Review
. 2012;31 Suppl 3(0 3):S169-88.
doi: 10.3233/JAD-2012-120412.

Structural brain atlases: design, rationale, and applications in normal and pathological cohorts

Affiliations
Review

Structural brain atlases: design, rationale, and applications in normal and pathological cohorts

Pravat K Mandal et al. J Alzheimers Dis. 2012.

Abstract

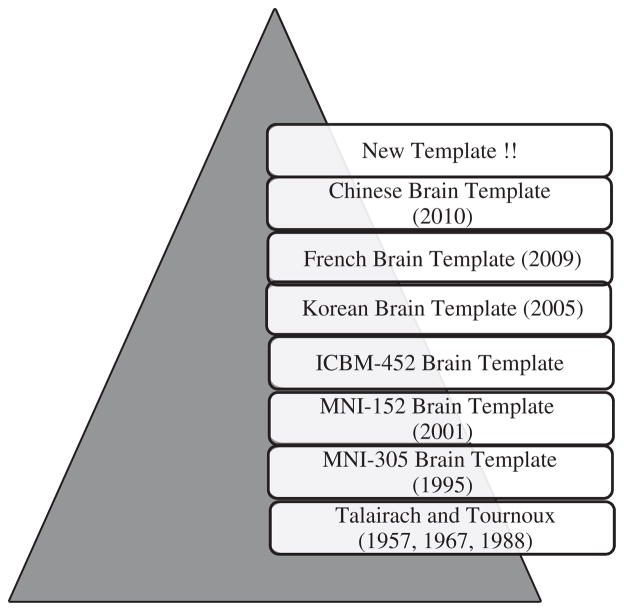
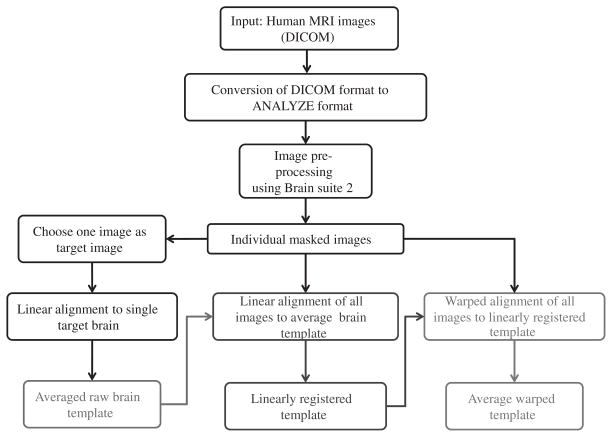
Structural magnetic resonance imaging (MRI) provides anatomical information about the brain in healthy as well as in diseased conditions. On the other hand, functional MRI (fMRI) provides information on the brain activity during performance of a specific task. Analysis of fMRI data requires the registration of the data to a reference brain template in order to identify the activated brain regions. Brain templates also find application in other neuroimaging modalities, such as diffusion tensor imaging and multi-voxel spectroscopy. Further, there are certain differences (e.g., brain shape and size) in the brains of populations of different origin and during diseased conditions like in Alzheimer's disease (AD), population and disease-specific brain templates may be considered crucial for accurate registration and subsequent analysis of fMRI as well as other neuroimaging data. This manuscript provides a comprehensive review of the history, construction and application of brain atlases. A chronological outline of the development of brain template design, starting from the Talairach and Tournoux atlas to the Chinese brain template (to date), along with their respective detailed construction protocols provides the backdrop to this manuscript. The manuscript also provides the automated workflow-based protocol for designing a population-specific brain atlas from structural MRI data using LONI Pipeline graphical workflow environment. We conclude by discussing the scope of brain templates as a research tool and their application in various neuroimaging modalities.


Figures

Fig. 1
Fig. 1
Existing human brain templates presented in chronological order. The first Talairach atlas was reported in 1957. In 1988, it was constructed from the postmortem brain of a 60 year old French woman. The MNI-305 brain template was constructed in 1995 from the average of 305 three dimensional MRI brain images (mean age = 23.4 ± 4.1 years). The MNI-152 brain template was constructed in 2001 using brain MRI images from 152 normal subjects. The ICBM-452 brain template was created in 2003. The Korean brain template was created in 2005 from 78 healthy (normal) Korean subjects (mean age 44.6 ± 19.4 years). The French brain template (constructed from a 45 year old Frenchman) was reported in 2009, and the Chinese brain template was created in 2010 using 56 young Chinese subjects (mean age 24.49 ± 1.76 years). New brain templates refer to template from Indian subcontinent and African continent etc.
Fig. 2
Fig. 2
Coordinate system introduced by Talairach and Tournoux. The anterior commissure (AC) and posterior commissure (PC) are the landmarks used for developing this standard reference coordinate system. Its origin was defined at the AC, with x-and y-axis defining the horizontal plane and z-axis defining the vertical axis. The original figure [15] is slightly modified and reproduced with permission.
Fig. 3
Fig. 3
General representation of brain MRI data in DICOM format. It consists of header which contains information relating to the subject and experimental parameters; and the corresponding image data.
Fig. 4
Fig. 4
Structure of different MRI data formats (e.g., DICOM, ANALYZE, and NIfTI).
Fig. 5
Fig. 5
General flowchart for the construction of population-specific brain template using LONI pipeline [8, 36]. At first, brain MRI images of the subjects of a population acquired in the DICOM format are converted to ANALYZE image format. Image pre-processing steps include the skull stripping and reorientation of the brain MRI images. The construction protocol includes mainly three steps: The averaged raw brain template is constructed first (red block will be in red color), to which each individual brain MRI image is linearly registered (to account for global shape and intensity differences) to get an averaged linear brain template (the color of green block would be in green color). This is followed by a non-linear registration (to account for local deformations) of each individual brain MRI images to the averaged linear brain template to get averaged non-linear brain template (Blue block will be in blue color).
Fig. 6
Fig. 6
Effects of affine transformation consisting of translation, rotation, scaling, and shearing operation are elaborated. This linear transformation is required to align the source images to the target image. This Figure is revised, modified from earlier work [118] and presented here.
Fig. 7
Fig. 7
Illustration of affine transformation on a 2D MRI image [51].
Fig. 8
Fig. 8
A) Transformed source image; B) Target image; C) After application of cubic B-splines using CC as the similarity measure on the transformed source image [119]. Source code (https://sites.google.com/site/myronenko/research/mirt) was used to convert the images.
Fig. 9
Fig. 9
A) Transformed source image; B) Target image; C) Normalized cross-correlation (NCC) between the transformed source image and target image displayed as a surface plot. The peak of the cross-correlation matrix occurs when the images are best correlated [55].
Fig. 10
Fig. 10
A) Transformed source image; B) Target image; C) The transformed source image after non-rigid registration using cubic B-splines with SSD as the similarity measure used [119]. Source code (https://sites.google.com/site/myronenko/research/mirt) was used to convert those images.
Fig. 11
Fig. 11
Illustration for the relations between individual (H(X), H(Y)), joint (H(X, Y) and conditional entropies for a pair of correlated images X and Y with mutual information I(X, Y) [68].
Fig. 12
Fig. 12
A) Transformed source image; B) Target image; (C) Transformed source image after non-rigid registration of the transformed source image and the target image using cubic B-spline, with MI as the similarity measure used Source code (https://sites.google.com/site/myronenko/research/mirt).
Fig. 13
Fig. 13
Illustration of false positive, true positive, false negative, and true negative through the Venn diagram [74].

References

    1. Roland PE, Zilles K. Brain atlases–a new research tool. Trends Neurosci. 1994;17:458–467. - PubMed
    1. Toga AW, Thompson PM. Brain Warping. Academic Press; Los Angeles: 1999. An introduction to brain warping; pp. 1–26.
    1. Toga AW, Thompson PM, Mori S, Amunts K, Zilles K. Towards multimodal atlases of the human brain. Nat Rev Neurosci. 2006;7:952–966. - PMC - PubMed
    1. Bohland JW, Bokil H, Allen CB, Mitra PP. The brain atlas concordance problem: Quantitative comparison of anatomical parcellations. PLoS One. 2009;4:e7200. - PMC - PubMed
    1. Rex DE, Ma JQ, Toga AW. The LONI pipeline processing environment. Neuroimage. 2003;19:1033–1048. - PubMed

Publication types

LinkOut - more resources