

Functional neuroimaging in craniopharyngioma: a useful tool to better understand hypothalamic obesity?
- PMID: 22647305
- PMCID: PMC6902258
- DOI: 10.1159/000338695
Functional neuroimaging in craniopharyngioma: a useful tool to better understand hypothalamic obesity?
Abstract
Objective: To use functional magnetic resonance imaging (fMRI) in craniopharyngioma (CP) patients to examine the hypothesis that hypothalamic damage due to CP and its treatment results in enhanced perception of food reward and/or impaired central satiety processing.
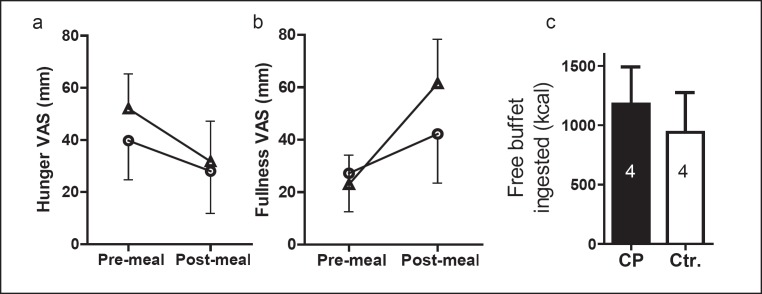
Methods: Pre- and post-meal responses to visual food cues in brain regions of interest (ROI; bilateral nucleus accumbens, bilateral insula, and medial orbitofrontal cortex) were assessed in 4 CP patients versus 4 age- and weight-matched controls. Stimuli consisted of images of high- ('fattening') and low-calorie ('non-fattening') foods in blocks, alternating with non-food object blocks. After the first fMRI scan, subjects drank a high-calorie test meal to suppress appetite, then completed a second fMRI scan. Within each ROI, we calculated mean z-scores for activation by fattening as compared to non-fattening food images.
Results: Following the test meal, controls showed suppression of activation by food cues while CP patients showed trends towards higher activation.
Conclusion: These data, albeit in a small group of patients, support our hypothesis that perception of food cues may be altered in hypothalamic obesity (HO), especially after eating, i.e. in the satiated state. The fMRI approach is encouraging for performing future mechanistic studies of the brain response to food cues and satiety in patients with hypothalamic or other forms of childhood obesity.
Copyright © 2012 S. Karger GmbH, Freiburg.
Conflict of interest statement
The authors did not provide a conflict of interest statement.
Figures


Similar articles
-
Activation in brain energy regulation and reward centers by food cues varies with choice of visual stimulus.Int J Obes (Lond). 2009 Jun;33(6):653-61. doi: 10.1038/ijo.2009.56. Epub 2009 Apr 14. Int J Obes (Lond). 2009. PMID: 19365394 Free PMC article.
-
Do scores on the Food Craving Inventory and Three-Factor Eating Questionnaire correlate with expected brain regions of interest in people with obesity?Physiol Behav. 2018 May 1;188:1-10. doi: 10.1016/j.physbeh.2018.01.018. Epub 2018 Feb 3. Physiol Behav. 2018. PMID: 29421336
-
Regional brain response to visual food cues is a marker of satiety that predicts food choice.Am J Clin Nutr. 2012 Nov;96(5):989-99. doi: 10.3945/ajcn.112.042341. Epub 2012 Sep 18. Am J Clin Nutr. 2012. PMID: 22990034 Free PMC article. Clinical Trial.
-
[Satiation and satiety in the regulation of energy intake].Rev Med Chil. 2017 Sep;145(9):1172-1178. doi: 10.4067/s0034-98872017000901172. Rev Med Chil. 2017. PMID: 29424405 Review. Spanish.
-
Nutrients, satiety, and control of energy intake.Appl Physiol Nutr Metab. 2015 Oct;40(10):971-9. doi: 10.1139/apnm-2014-0549. Epub 2015 May 13. Appl Physiol Nutr Metab. 2015. PMID: 26394262 Review.
Cited by
-
What Should I Eat and Why? The Environmental, Genetic, and Behavioral Determinants of Food Choice: Summary from a Pennington Scientific Symposium.Obesity (Silver Spring). 2020 Aug;28(8):1386-1396. doi: 10.1002/oby.22806. Epub 2020 Jun 10. Obesity (Silver Spring). 2020. PMID: 32520444 Free PMC article. Review.
-
Risk-adapted, long-term management in childhood-onset craniopharyngioma.Pituitary. 2017 Apr;20(2):267-281. doi: 10.1007/s11102-016-0751-0. Pituitary. 2017. PMID: 27604996 Review.
-
Treatment of Acquired Hypothalamic Obesity: Now and the Future.Front Endocrinol (Lausanne). 2022 Apr 6;13:846880. doi: 10.3389/fendo.2022.846880. eCollection 2022. Front Endocrinol (Lausanne). 2022. PMID: 35464063 Free PMC article. Review.
-
Cognitive interference processing in adults with childhood craniopharyngioma using functional magnetic resonance imaging.Endocrine. 2021 Dec;74(3):714-722. doi: 10.1007/s12020-021-02824-9. Epub 2021 Jul 22. Endocrine. 2021. PMID: 34292485 Free PMC article.
-
Obesity mechanism after hypothalamic damage: Cohort analysis of neuroimaging, psychological, cognitive, and clinical phenotyping data.Front Endocrinol (Lausanne). 2023 Mar 28;14:1114409. doi: 10.3389/fendo.2023.1114409. eCollection 2023. Front Endocrinol (Lausanne). 2023. PMID: 37056667 Free PMC article.
References
-
- Harwood-Nash DC. Neuroimaging of childhood craniopharyngioma. Pediatr Neurosurg. 1994;21((suppl 1)):2–10. - PubMed
-
- Rajan B, Ashley S, Gorman C, Jose CC, Horwich A, Bloom HJ, Marsh H, Brada M. Craniopharyngioma – a long-term results following limited surgery and radiotherapy. Radiother Oncol. 1993;26:1–10. - PubMed
-
- Becker G, Kortmann RD, Skalej M, Bamberg M. The role of radiotherapy in the treatment of craniopharyngioma – indications, results, side effects. Front Radiat Ther Oncol. 1999;33:100–113. - PubMed
-
- Fahlbusch R, Honegger J, Paulus W, Huk W, Buchfelder M. Surgical treatment of craniopharyngiomas: experience with 168 patients. J Neurosurg. 1999;90:237–250. - PubMed
-
- Muller HL. Childhood craniopharyngioma – current concepts in diagnosis, therapy and follow-up. Nat Rev Endocrinol. 2010;6:609–618. - PubMed
Publication types
MeSH terms
Grants and funding
LinkOut - more resources
Full Text Sources
Medical
Miscellaneous
