. 2012 Jul 1;8(7):1098-112.
doi: 10.4161/auto.20268. Epub 2012 May 31.

MAPK14/p38α confers irinotecan resistance to TP53-defective cells by inducing survival autophagy

Affiliations

MAPK14/p38α confers irinotecan resistance to TP53-defective cells by inducing survival autophagy

Salome Paillas et al. Autophagy. .

Abstract

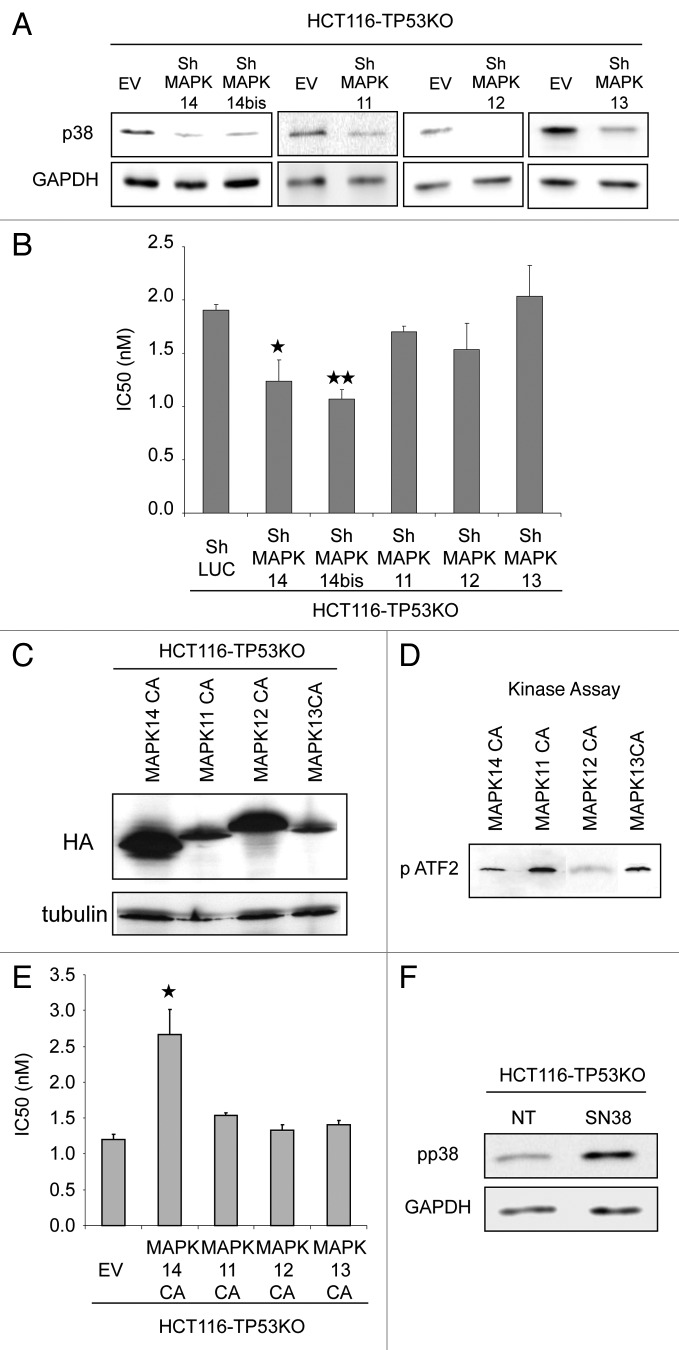
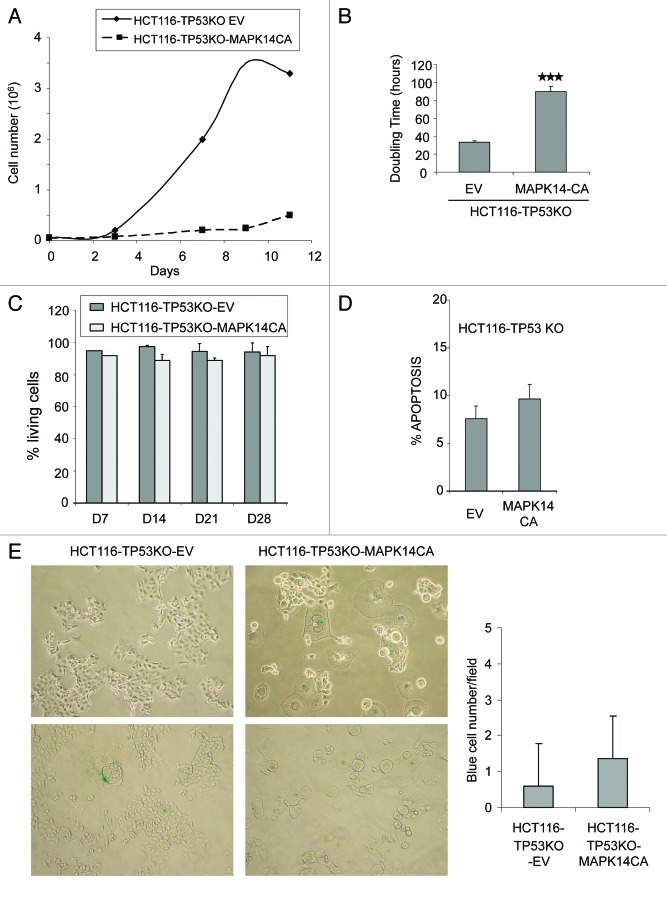
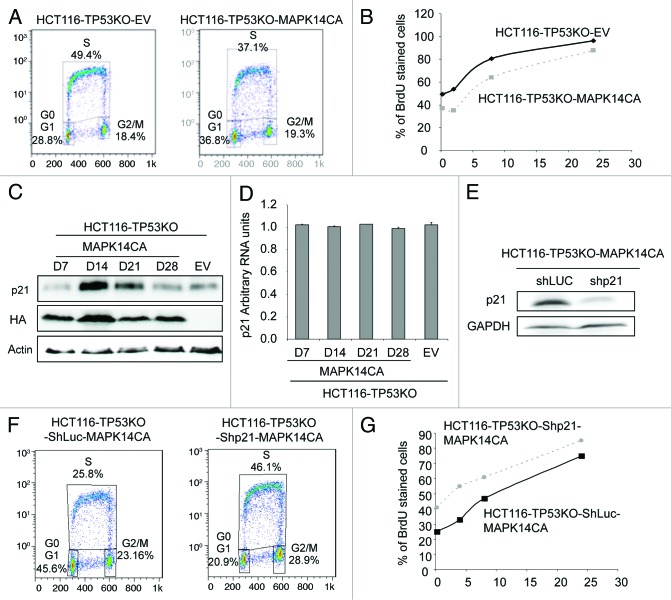
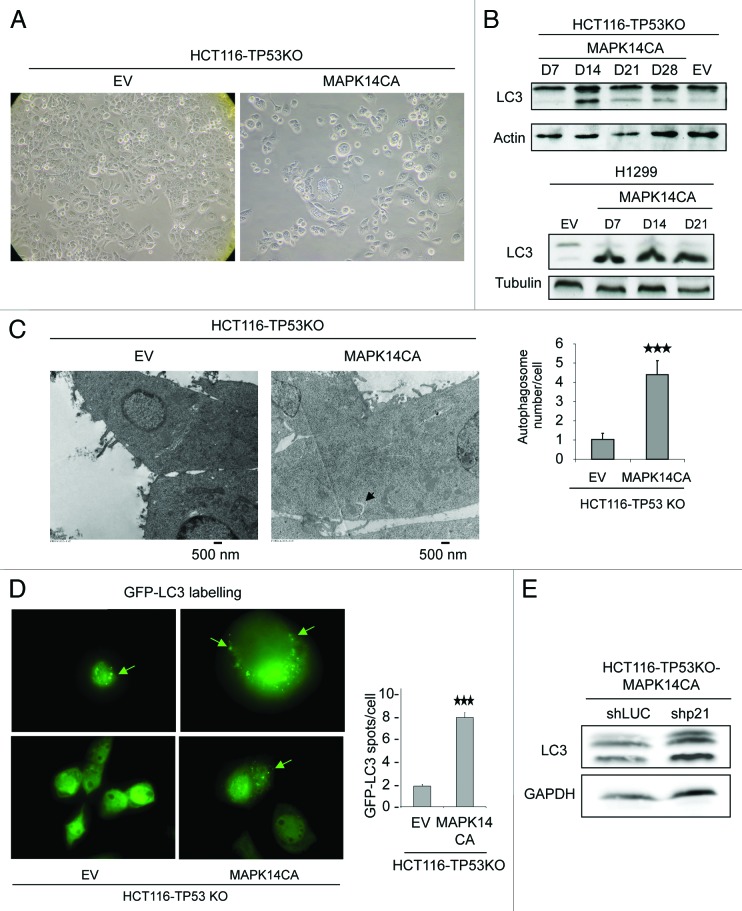
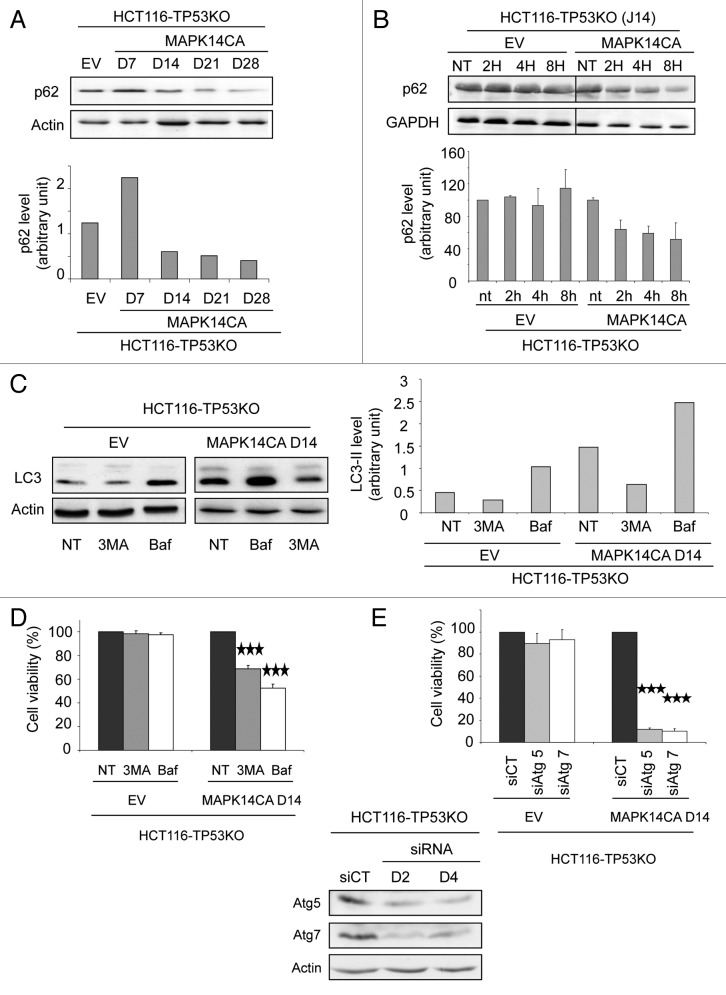
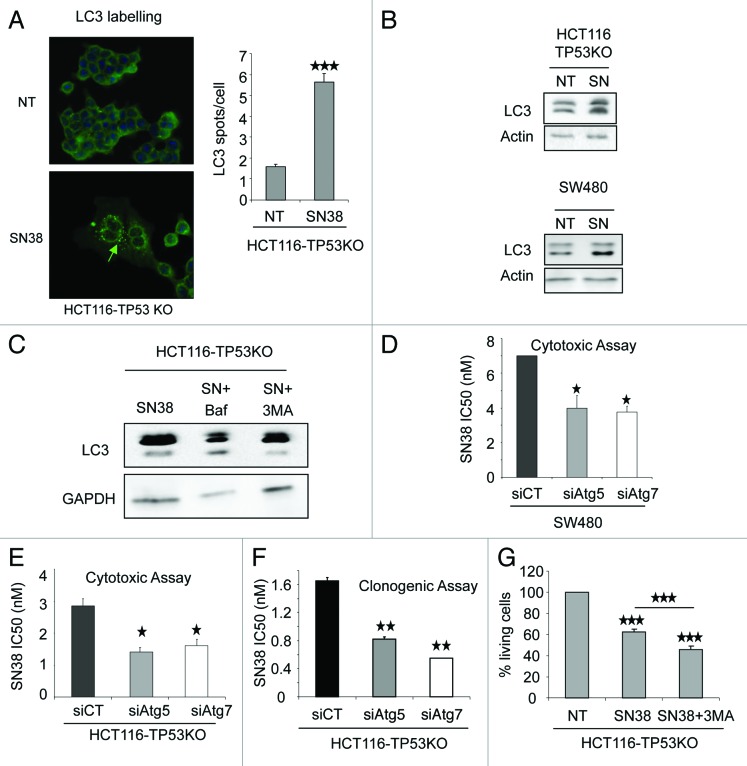
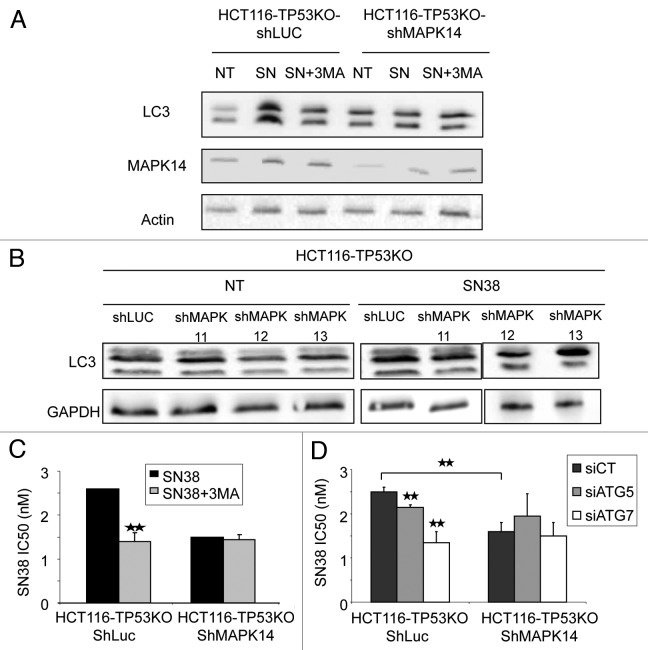
Recently we have shown that the mitogen-activated protein kinase (MAPK) MAPK14/p38α is involved in resistance of colon cancer cells to camptothecin-related drugs. Here we further investigated the cellular mechanisms involved in such drug resistance and showed that, in HCT116 human colorectal adenocarcinoma cells in which TP53 was genetically ablated (HCT116-TP53KO), overexpression of constitutively active MAPK14/p38α decreases cell sensitivity to SN-38 (the active metabolite of irinotecan), inhibits cell proliferation and induces survival-autophagy. Since autophagy is known to facilitate cancer cell resistance to chemotherapy and radiation treatment, we then investigated the relationship between MAPK14/p38α, autophagy and resistance to irinotecan. We demonstrated that induction of autophagy by SN38 is dependent on MAPK14/p38α activation. Finally, we showed that inhibition of MAPK14/p38α or autophagy both sensitizes HCT116-TP53KO cells to drug therapy. Our data proved that the two effects are interrelated, since the role of autophagy in drug resistance required the MAPK14/p38α. Our results highlight the existence of a new mechanism of resistance to camptothecin-related drugs: upon SN38 induction, MAPK14/p38α is activated and triggers survival-promoting autophagy to protect tumor cells against the cytotoxic effects of the drug. Colon cancer cells could thus be sensitized to drug therapy by inhibiting either MAPK14/p38 or autophagy.

Keywords: MAPK14/p38; chemotherapy; colon cancer; irinotecan resistance; survival autophagy.


Figures

None
Figure 1. MAPK14 plays a role in the sensitivity to SN38 of HCT116-TP53KO cells. (A) Western blot analysis of MAPK14, MAPK14bis, MAPK11, MAPK12, MAPK13 expression in HCT116-TP53KO cells transduced with ShRNAs directed against MAPK14, MAPK11, MAPK12, MAPK13 or against Luciferase (ShLuc) (control). Equal loading is shown by GAPDH. (B) SRB assays to assess SN38 cytotoxicity in HCT116-TP53KO cells that stably express ShRNA targeting MAPK14, MAPK11, MAPK12, MAPK13 or ShLuc (control). (C) Western blot analysis (anti-HA antibody) of HCT116-TP53KO cells that express constitutively active MAPK14, MAPK11, MAPK12, MAPK13 (MAPK14-CA, MAPK11-CA, MAPK12-CA, MAPK13-CA) or empty vector (EV), as a control. Equal loading is shown by tubulin. (D) Kinase assay performed with 2 µg of recombinant MAPK14, MAPK11, MAPK12 and MAPK13 to test p38 constitutively active isoforms activity. Western blot analysis of phosphorylated ATF2. (E) SRB assay to evaluate SN38 cytotoxicity in HCT116-TP53KO cells that stably express MAPK14, MAPK11, MAPK12, MAPK13-CA or EV. (F) Western blot analysis (anti-phospho p38 antibody) of HCT116-TP53KO treated or not with SN38, 1 µM 24h00. Equal loading is shown by GAPDH.
None
Figure 2. Overexpression of constitutively active MAPK14 inhibits cell growth in HCT116-TP53KO cells. (A) Growth curve of HCT116-TP53KO-EV and HCT116-TP53KO-MAPK-CA cells cultured in complete medium (10% FCS). (B) Doubling time histograms of HCT116-TP53KO-EV and HCT116-TP53KO-MAPK14-CA determined at day 14 after retroviral transduction of MAPK14-CA or EV. (C) Percentage of living cells in HCT116-TP53KO-EV and HCT116-TP53KO-MAPK14-CA cells at day (d) 7, 14, 21 and 28 after retroviral transduction. The number of viable cells was determined by counting the number of cells not stained by the Trypan blue dye. Data are representative of three independent experiments. (D) Quantification of apoptosis in HCT116-TP53KO-EV and HCT116-TP53KO-MAPK14-CA cells at day 14 after retroviral transduction of MAPK14-CA or pMSCV empty vector (EV). Apoptosis was determined by quantifying the number of 7AAD-negative and Annexin V-FLUOS-positive cells with a FACScan flow cytometer. (E) Senescence-associated β-galactosidase staining in HCT116-TP53KO-EV and HCT116-TP53KO-MAPK14-CA cells at day 14 after retroviral transduction of MAPK14-CA or EV. The number of β-galactosidase-positive (blue) cells was counted in 20 fields for each cell type.
None
Figure 3. The proliferation inhibition of HCT116-TP53KO-MAPK14-CA cells correlates with p21 overexpression. (A) Cell cycle distribution of HCT116-TP53KO-EV and HCT116-TP53KO-MAPK14-CA cells at day 14 after retroviral transduction of MAPK14-CA or pMSCV empty vector (EV). The cell cycle distribution was evaluated after 15 min of BrDU staining with a FACScan flow cytometer. (B) Percentage of BrdU stained HCT116-TP53KO-EV and HCT116-TP53KO-MAPK14-CA cells after 15 min, 2, 8 and 24 h of BrdU incubation. (C) Western blot analysis (anti- CDKN1A antibody and anti-HA antibody to evaluate the expression of MAPK14-CA) of HCT116-TP53KO-EV (control) and HCT116-TP53KO-MAPK14-CA cells at day 7, 14, 21 and 28 following retroviral transduction (only day 14 is shown for control cells as CDKN1A level did not change). Equal loading was assessed with an anti-actin antibody. (D) CDKN1A mRNA levels were determined by real-time qPCR in HCT116-TP53KO-MAPK14-CA cells at days 7, 14, 21 and 28 after retroviral transduction (only day 14 for HCT116-TP53KO-EV cells as expression was unchanged). (E) Western blot analysis of CDKN1A expression in HCT116-TP53KO-MAPK14-CA and HCT116-TP53KO-EV (control) cells after retroviral transduction of ShRNA targeting CDKN1A (Shp21) or Luciferase (ShLuc), respectively. Equal loading is shown by GAPDH expression. (F) Cell cycle distribution of HCT116-TP53KO-ShLuc-MAPK14-CA and HCT116-TP53KO-Shp21-MAPK14-CA cells at day 14 after retroviral transduction. The cell cycle distribution was evaluated after 15 min of BrDU staining with a FACScan flow cytometer. (G) Percentage of BrdU stained HCT116-TP53KO-ShLuc-MAPK14-CA and HCT116-TP53KO-Shp21-MAPK14-CA cells after 15 min, 4, 8 and 24 h of BrdU incubation.
None
Figure 4. Overexpression of constitutively active MAPK14 induces autophagy in HCT116-TP53KO cells. (A) Phase-contrast images describing the morphology of HCT116-TP53KO-EV and HCT116-TP53KO-MAPK14-CA cells at day 14 after retroviral transduction. (B) Analysis of the expression of LC3-I and LC3-II by western blotting in HCT116-TP53KO (top panel) and H1299 (TP53-deficient lung cancer cells) (low panel) cells that express constitutively active MAPK14 (MAPK14-CA) or empty vector (EV), as a control at day 7, 14, 21 and 28 following retroviral transduction. Only day 14 is shown for cells transduced with EV as LC3 expression was unchanged. Equal loading is shown by actin expression. (C, left panel) Electron micrographs of HCT116-TP53KO-EV and HCT116-TP53KO-MAPK14-CA cells at day 15 after retroviral transduction. Arrow indicates the presence of a double-membrane vacuole. (C, right panel) Number of autophagosomes/cell in HCT116-TP53KO-EV and HCT116-TP53KO-MAPK14-CA cells at day 15 after retroviral transduction (100 cells were counted for each cell type). (D, left panel) HCT116-TP53KO-EV and HCT116-TP53KO-MAPK14-CA cells expressing GFP-LC3 were analyzed by immunofluorescence. The pattern of GFP-LC3 expression in the cytosol changed from diffuse to punctate/vesicular. (D, right panel) The number of vesicular GFP-LC3 spots/cell in HCT116-TP53KO-EV and HCT116-TP53KO-MAPK14-CA cells was scored (100 cells were counted for each cell type). The results are represented as the mean ± SD. (E) Western blot analysis (anti-LC3 antibody) of HCT116-TP53KO-ShLuc-MAPK14-CA and HCT116-TP53KO-Shp21-MAPK14-CA cells. Equal loading is shown by GAPDH.
None
Figure 5. Autophagy in HCT116-TP53KO-MAPK14-CA cells promotes cell survival. (A, top panel) Western blot analysis of SQSTM1/p62 expression in HCT116-TP53KO-MAPK14-CA cells at day 7, 14, 21 and 28 following retroviral transduction (only day 14 is shown for control HCT116-TP53KO-EV cells as expression did not change). Equal loading is shown by actin expression. (A, bottom panel) Quantification of SQSTM1 expression relative to β-actin in control HCT116-TP53KO-EV (day 14) and HCT116-TP53KO-MAPK14-CA cells at day 7, 14, 21 and 28 following retroviral transduction. (B, top panel) Western blot analysis of SQSTM1 expression in HCT116-TP53KO-EV and HCT116-TP53KO-MAPK14-CA cells at day 14 following retroviral transduction after cycloheximide chase (2, 4 and 8 h of cycloheximide treatment). Equal loading is shown by GAPDH expression. (B, bottom panel) Quantification of SQSTM1 expression relative to GAPDH in HCT116-TP53KO-EV and HCT116-TP53KO-MAPK14-CA cells at day 14 following retroviral transduction after cycloheximide chase. (C, left panel) Western blot analysis of the expression of LC3-I and LC3-II in HCT116-TP53KO-MAPK14-CA and control HCT116-TP53KO-EV cells at day 14 after retroviral transduction following incubation or not (NT) with 3-methyladenine (3MA) or bafilomycin A1 (Baf). Equal loading is shown by actin expression. (C, right panel) Quantification of LC3-II expression relative to β-actin in control and HCT116-TP53KO-MAPK14-CA cells incubated or not (NT) with 3MA or Baf. (D) Cell viability of HCT116-TP53KO-MAPK14-CA and control HCT116-TP53KO-EV cells at day 14 after retroviral transduction, incubated or not with 3-methyladenine (3MA) or bafilomycin A1 (Baf) for 72 h. The number of viable cells was determined by counting the cells not stained with the Trypan blue dye. Data are representative of three independent experiments. (E, top panel) Cell viability of HCT116-TP53KO-MAPK14-CA and control HCT116-TP53KO-EV cells at day 14 after retroviral transduction, following transfection with control siRNA or anti-ATG5 or -ATG7 siRNAs. The number of viable cells was determined by counting the cells not stained with the Trypan blue dye. Data are representative of three independent experiments. (E, bottom panel) Western blot analysis of ATG5 and ATG7 expression in HCT116-TP53KO-MAPK14-CA cells at day 2 (d2) and 4 (d4) after transfection with control siRNA or anti-ATG5 or -ATG7 siRNAs (similar results were obtained for HCT116-TP53KO-EV). Equal loading is shown by actin expression.
None
Figure 6. Inhibition of autophagy enhances the cytotoxic effect of SN38 on p53-defective colorectal cancer cells. (A, left panel) LC3 staining analyzed by immunofluorescence of HCT116-TP53KO cells treated or not (NT) with 1 µM SN38 for 24 h. The pattern of LC3 expression in the cytosol changed from diffuse to punctate/vesicular. (A, right panel) The number of vesicular LC3 spots/cell in HCT116-TP53KO cells treated or not with 1 µM SN38 for 24 h was scored (100 cells were counted for each cell type). The results are represented as the mean ± SD. (B) Western blot analysis of LC3-I and LC3-II expression in HCT116-TP53KO and SW480 cells treated or not (NT) with 1 µM SN38 for 24 h. Equal loading is shown by actin expression. (C) Western blot analysis of HCT116-TP53KO treated with Baf, SN38, SN38+Baf and SN38, SN38+3MA. Equal loading is shown by GAPDH expression. (D) SRB assays to assess SN38 cytotoxicity in SW480 cells transfected with control siRNA or anti-ATG5 or -ATG7 siRNAs. (E) SRB assays to assess SN38 cytotoxicity in HCT116-TP53KO cells transfected with control siRNA or anti-ATG5 or -ATG7 siRNAs. (F) Clonogenic assay to assess SN38 cytotoxicity in HCT116-TP53KO cells transfected with control siRNA or anti-ATG5 or -ATG7 siRNAs. (G) Percentage of living cells in HCT116-TP53KO treated with SN38 or SN38 + 3MA. The number of viable cells was determined by counting the number of cells not stained by the Trypan blue dye. Data are representative of three independent experiments.
None
Figure 7. Involvement of autophagy in SN38 resistance depends upon MAPK14. (A) Western blot analysis of LC3-I and II and MAPK14 expression in HCT116-TP53KO-ShLuc and HCT116-TP53KO-ShMAPK14 cells after treatment or not (NT) with 2 nM SN38 alone (SN) or with 10 nM 3-methyladenine (SN+3MA) for 96 h. (B) Western blot analysis of LC3-I and II of HCT116-TP53KO-ShLuc, HCT116-TP53KO-ShMAPK11, HCT116-TP53KO-ShMAPK12 and HCT116-TP53KO-ShMAPK13 cells after treatment or not (NT) with 2 nM SN38 alone (SN) for 96 h. (C) SRB assays to assess the cytotoxicity of SN38 alone or in combination with 3-methyladenine (SN38+3MA) in HCT116-TP53KO-ShLuc and HCT116-TP53KO-ShMAPK14 cells. (D) SRB assays to assess SN38 cytotoxicity of HCT116-TP53KO-ShLuc and HCT116-TP53KO-ShMAPK14 cells transfected with control siRNA or anti-ATG5 or -ATG7 siRNAs.

References

    1. Segal NH, Saltz LB. Evolving treatment of advanced colon cancer. Annu Rev Med. 2009;60:207–19. doi: 10.1146/annurev.med.60.041807.132435. - DOI - PubMed
    1. Lièvre A, Bachet JB, Le Corre D, Boige V, Landi B, Emile JF, et al. KRAS mutation status is predictive of response to cetuximab therapy in colorectal cancer. Cancer Res. 2006;66:3992–5. doi: 10.1158/0008-5472.CAN-06-0191. - DOI - PubMed
    1. Pommier Y. Topoisomerase I inhibitors: camptothecins and beyond. Nat Rev Cancer. 2006;6:789–802. doi: 10.1038/nrc1977. - DOI - PubMed
    1. Xu Y, Villalona-Calero MA. Irinotecan: mechanisms of tumor resistance and novel strategies for modulating its activity. Ann Oncol. 2002;13:1841–51. doi: 10.1093/annonc/mdf337. - DOI - PubMed
    1. Gongora C, Candeil L, Vezzio N, Copois V, Denis V, Breil C, et al. Altered expression of cell proliferation-related and interferon-stimulated genes in colon cancer cells resistant to SN38. Cancer Biol Ther. 2008;7:822–32. doi: 10.4161/cbt.7.6.5838. - DOI - PubMed

Publication types

MeSH terms

Substances