

Associations of current and remitted major depressive disorder with brain atrophy: the AGES-Reykjavik Study
- PMID: 22647536
- PMCID: PMC4244840
- DOI: 10.1017/S0033291712001110
Associations of current and remitted major depressive disorder with brain atrophy: the AGES-Reykjavik Study
Abstract
Background: To examine whether lifetime DSM-IV diagnosis of major depressive disorder (MDD), including age at onset and number of episodes, is associated with brain atrophy in older persons without dementia.
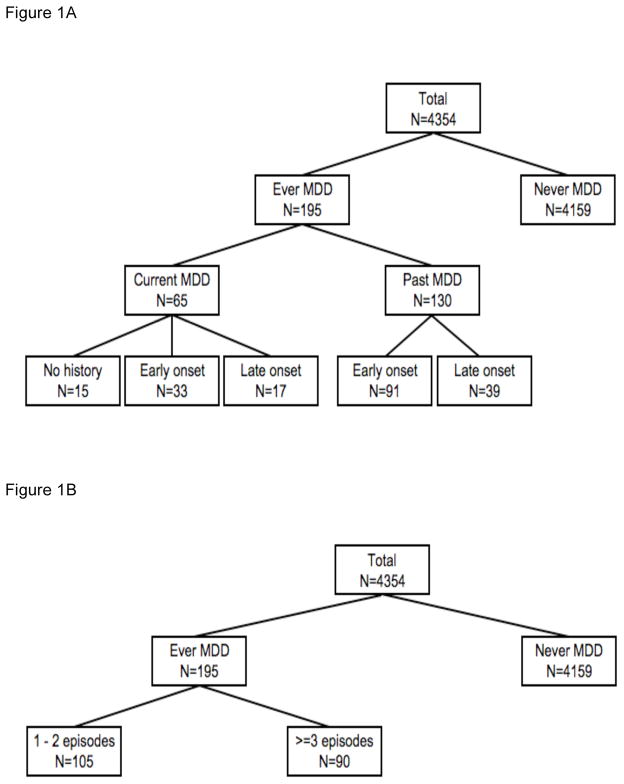
Method: Within the population-based Age, Gene/Environment Susceptibility (AGES)-Reykjavik Study, 4354 persons (mean age 76 ± 5 years, 58% women) without dementia had a 1.5-T brain magnetic resonance imaging (MRI) scan. Automated brain segmentation total and regional brain volumes were calculated. History of MDD, including age at onset and number of episodes, and MDD in the past 2 weeks was diagnosed according to DSM-IV criteria using the Mini-International Neuropsychiatric Interview (MINI).
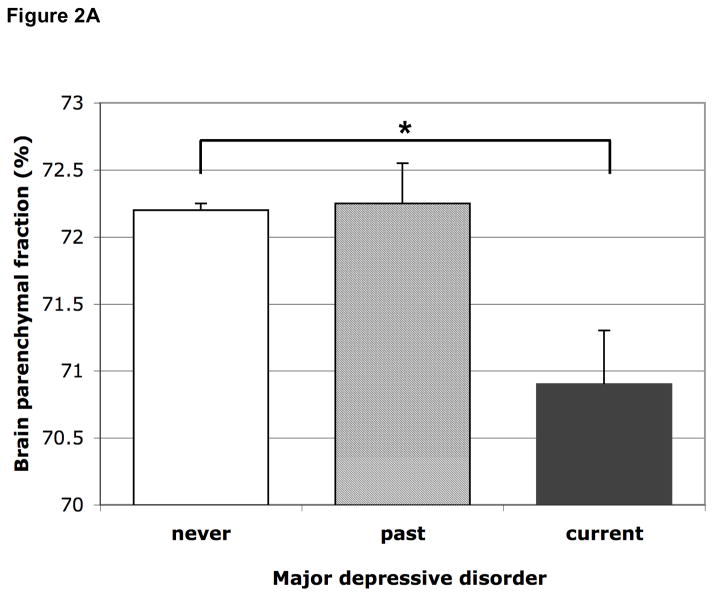
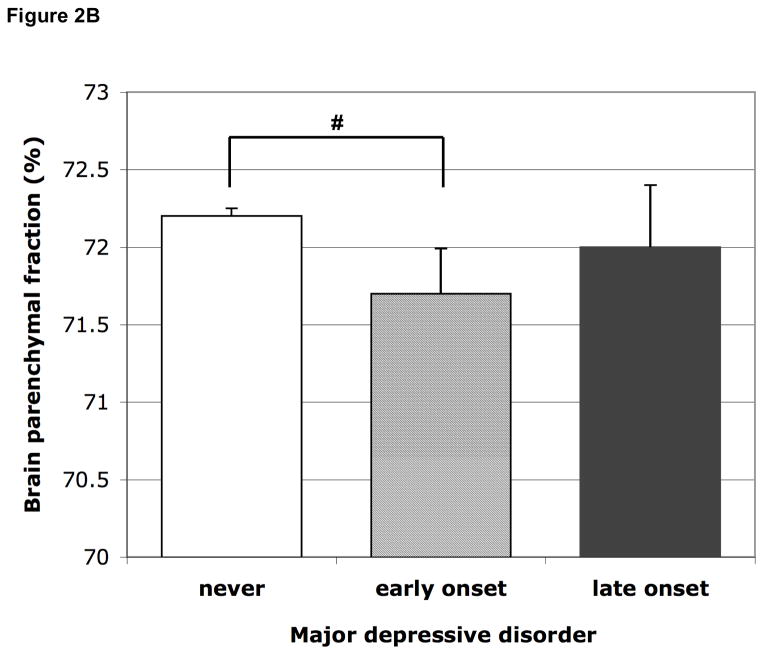
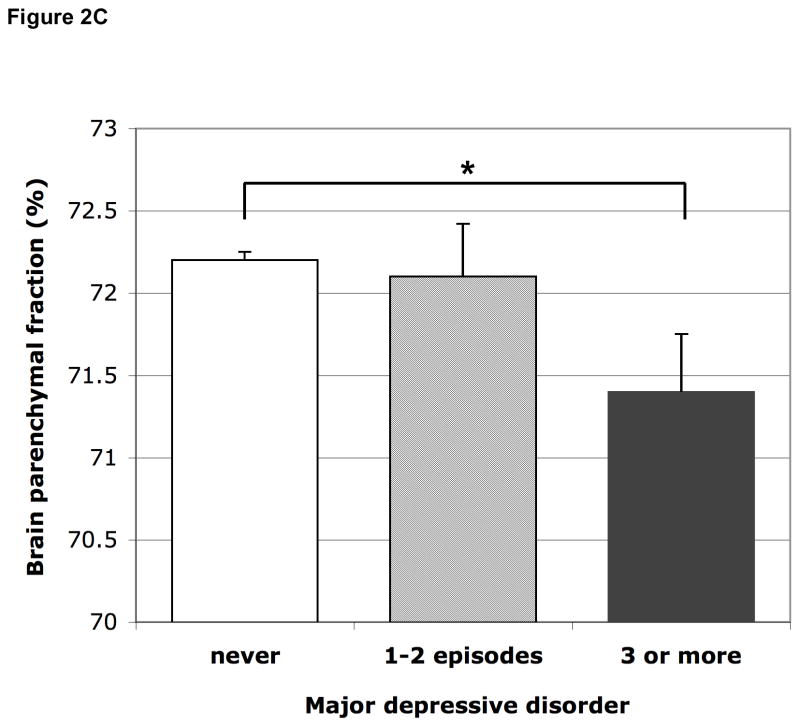
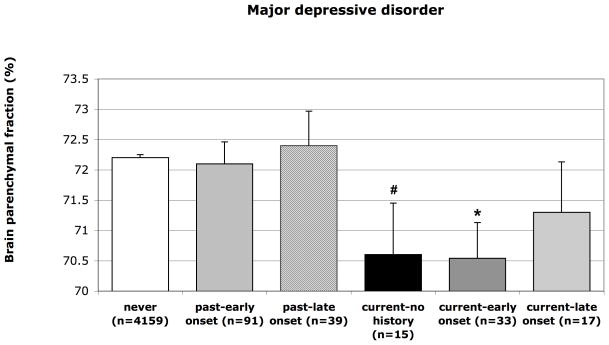
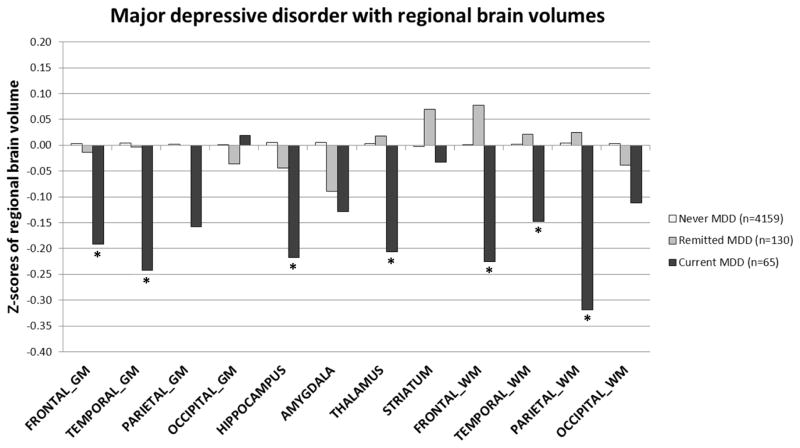
Results: Of the total sample, 4.5% reported a lifetime history of MDD; 1.5% had a current diagnosis of MDD (including 75% with a prior history of depression) and 3.0% had a past but no current diagnosis (remission). After adjusting for multiple covariates, compared to participants never depressed, those with current MDD (irrespective of past) had more global brain atrophy [B = -1.25%, 95% confidence interval (CI) -2.05 to -0.44], including more gray- and white-matter atrophy in most lobes, and also more atrophy of the hippocampus and thalamus. Participants with current, first-onset MDD also had more brain atrophy (B = -1.62%, 95% CI -3.30 to 0.05) whereas those remitted did not (B = 0.06%, 95% CI -0.54 to 0.66).
Conclusions: In older persons without dementia, current MDD, irrespective of prior history, but not remitted MDD was associated with widespread gray- and white-matter brain atrophy. Prospective studies should examine whether MDD is a consequence of, or contributes to, brain volume loss and development of dementia.
Figures
Similar articles
-
Migraine, depression, and brain volume: the AGES-Reykjavik Study.Neurology. 2013 Jun 4;80(23):2138-44. doi: 10.1212/WNL.0b013e318295d69e. Epub 2013 May 22. Neurology. 2013. PMID: 23700334 Free PMC article.
-
Depression and Dementia: The Role of Cortisol and Vascular Brain Lesions. AGES-Reykjavik Study.J Alzheimers Dis. 2022;85(4):1677-1687. doi: 10.3233/JAD-215241. J Alzheimers Dis. 2022. PMID: 34958034 Free PMC article.
-
Lifetime major depression and grey-matter volume.J Psychiatry Neurosci. 2019 Jan 1;44(1):45-53. doi: 10.1503/jpn.180026. J Psychiatry Neurosci. 2019. PMID: 30565905 Free PMC article.
-
Global hippocampal atrophy in major depressive disorder: a meta-analysis of magnetic resonance imaging studies.Trends Psychiatry Psychother. 2018 Oct-Dec;40(4):369-378. doi: 10.1590/2237-6089-2017-0130. Epub 2018 Sep 17. Trends Psychiatry Psychother. 2018. PMID: 30234890
-
Subgenual anterior cingulate cortex and hippocampal volumes in depressed youth: The role of comorbidity and age.J Affect Disord. 2016 Jan 15;190:726-732. doi: 10.1016/j.jad.2015.10.064. Epub 2015 Nov 12. J Affect Disord. 2016. PMID: 26600415 Review.
Cited by
-
Medial temporal lobe volumes in late-life depression: effects of age and vascular risk factors.Brain Imaging Behav. 2020 Feb;14(1):19-29. doi: 10.1007/s11682-018-9969-y. Brain Imaging Behav. 2020. PMID: 30251182 Free PMC article.
-
Hippocampus atrophy and the longitudinal course of late-life depression.Am J Geriatr Psychiatry. 2014 Dec;22(12):1504-12. doi: 10.1016/j.jagp.2013.11.004. Epub 2013 Nov 22. Am J Geriatr Psychiatry. 2014. PMID: 24378256 Free PMC article.
-
Depression and serum 25-hydroxyvitamin D in older adults living at northern latitudes - AGES-Reykjavik Study.J Nutr Sci. 2015 Nov 20;4:e37. doi: 10.1017/jns.2015.27. eCollection 2015. J Nutr Sci. 2015. PMID: 26688723 Free PMC article.
-
Age-dependent brain morphometry in Major Depressive disorder.Neuroimage Clin. 2022;33:102924. doi: 10.1016/j.nicl.2021.102924. Epub 2021 Dec 23. Neuroimage Clin. 2022. PMID: 34959051 Free PMC article.
-
Hippocampal atrophy and subsequent depressive symptoms in older men and women: results from a 10-year prospective cohort.Am J Epidemiol. 2014 Aug 15;180(4):385-93. doi: 10.1093/aje/kwu132. Epub 2014 Aug 1. Am J Epidemiol. 2014. PMID: 25086051 Free PMC article.
References
-
- Ahdidan J, Hviid LB, Chakravarty MM, Ravnkilde B, Rosenberg R, Rodell A, Stodkilde-Jorgensen H, Videbech P. Longitudinal MR study of brain structure and hippocampus volume in major depressive disorder. Acta Psychiatrica Scandinavia. 2011;123:211–9. - PubMed
-
- Ashtari M, Greenwald BS, Kramer-Ginsberg E, Hu J, Wu H, Patel M, Aupperle P, Pollack S. Hippocampal/amygdala volumes in geriatric depression. Psychological Medicine. 1999;29:629–638. - PubMed
-
- American Psychiatric Association. Diagnostic and Statistical Manual of Mental Disorders, DSM-IV. American Psychiatric Association; Washington, DC: 1994.
-
- Ballmaier M, Sowell ER, Thompson PM, Kumar A, Narr KL, Lavretsky H, Welcome SE, DeLuca H, Toga AW. Mapping brain size and cortical gray matter changes in elderly depression. Biological Psychiatry. 2004;55:382–389. - PubMed
Publication types
MeSH terms
Grants and funding
LinkOut - more resources
Full Text Sources
Miscellaneous
