Clinical Trial
. 2012 May 30;16(3):R98.
doi: 10.1186/cc11366.

Clinical validation of a new thermodilution system for the assessment of cardiac output and volumetric parameters

Clinical Trial

Clinical validation of a new thermodilution system for the assessment of cardiac output and volumetric parameters

Nicholas Kiefer et al. Crit Care. .

Abstract

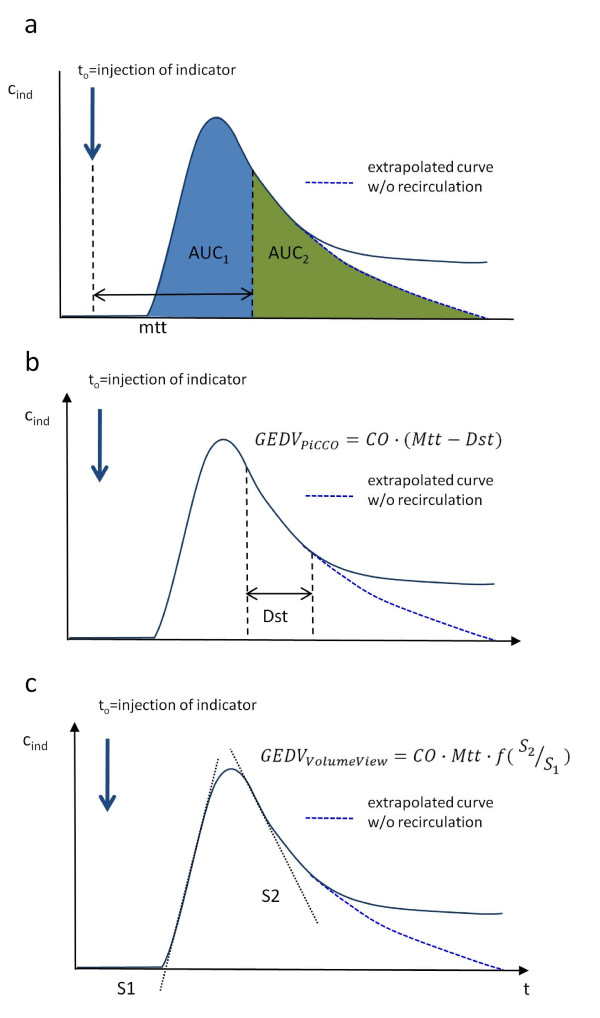
Introduction: Transpulmonary thermodilution is used to measure cardiac output (CO), global end-diastolic volume (GEDV) and extravascular lung water (EVLW). A system has been introduced (VolumeView/EV1000™ system, Edwards Lifesciences, Irvine CA, USA) that employs a novel algorithm for the mathematical analysis of the thermodilution curve. Our aim was to evaluate the agreement of this method with the established PiCCO™ method (Pulsion Medical Systems SE, Munich, Germany, clinicaltrials.gov identifier: NCT01405040) METHODS: Seventy-two critically ill patients with clinical indication for advanced hemodynamic monitoring were included in this prospective, multicenter, observational study. During a 72-hour observation period, 443 sets of thermodilution measurements were performed with the new system. These measurements were electronically recorded, converted into an analog resistance signal and then re-analyzed by a PiCCO2™ device (Pulsion Medical Systems SE).

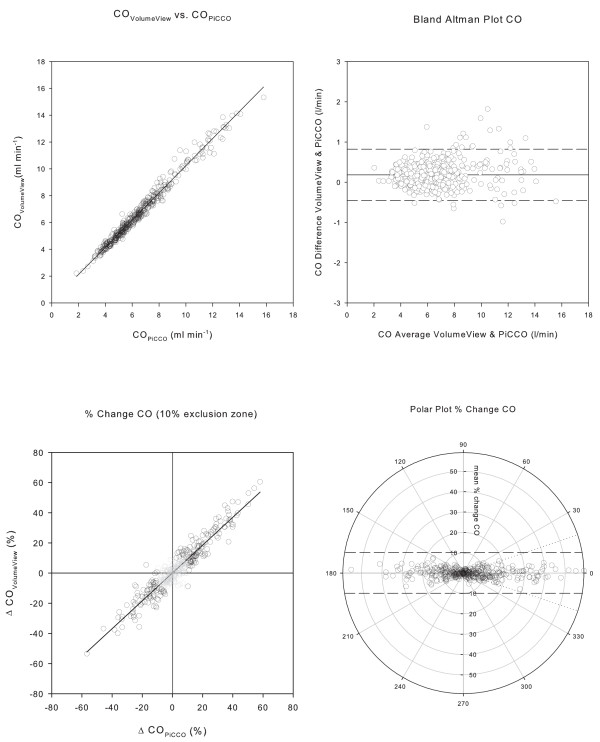
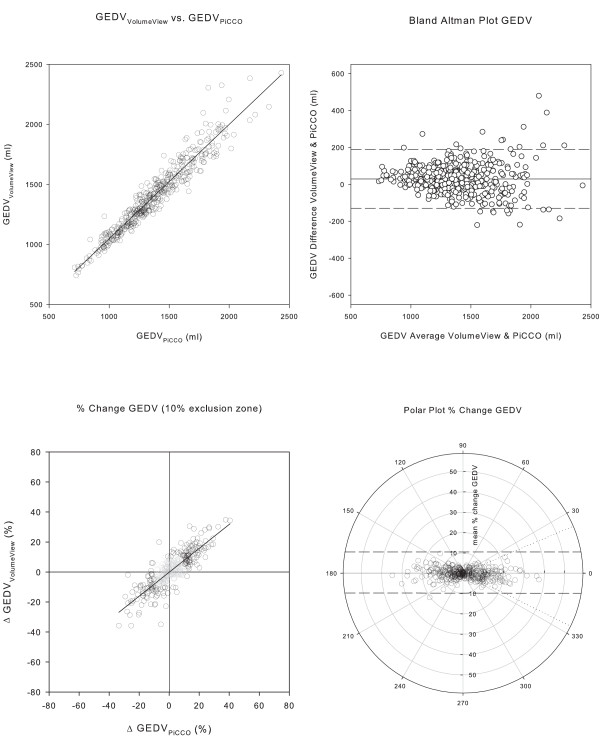
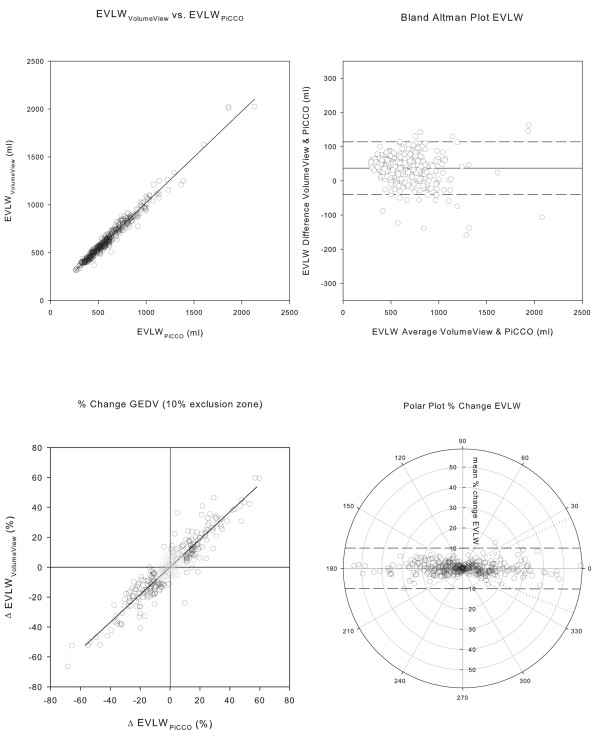
Results: For CO, GEDV, and EVLW, the systems showed a high correlation (r(2) = 0.981, 0.926 and 0.971, respectively), minimal bias (0.2 L/minute, 29.4 ml and 36.8 ml), and a low percentage error (9.7%, 11.5% and 12.2%). Changes in CO, GEDV and EVLW were tracked with a high concordance between the two systems, with a traditional concordance for CO, GEDV, and EVLW of 98.5%, 95.1%, and 97.7% and a polar plot concordance of 100%, 99.8% and 99.8% for CO, GEDV, and EVLW, respectively. Radial limits of agreement for CO, GEDV and EVLW were 0.31 ml/minute, 81 ml and 40 ml, respectively. The precision of GEDV measurements was significantly better using the VolumeView™ algorithm compared to the PiCCO™ algorithm (0.033 (0.03) versus 0.040 (0.03; median (interquartile range), P = 0.000049).

Conclusions: For CO, GEDV, and EVLW, the agreement of both the individual measurements as well as measurements of change showed the interchangeability of the two methods. For the VolumeView method, the higher precision may indicate a more robust GEDV algorithm.

Trial registration: clinicaltrials.gov NCT01405040.


Figures

Figure 1
Figure 1
Mathematical analysis of the thermodilution curve. Panel a) Both algorithms rely on mean transit time (Mtt), the time required for half of the indicator to pass the thermistor in the femoral artery. Mtt divides the area under the curve (AUC) into two areas of the same size (AUC1 and AUC2). Panel b) Downslope time (Dst) is part of the PiCCO™ GEDV algorithm. It is the time of the temperature decay between two set points in the thermodilution curve, for example, 80% to 40%. Theoretically, the decay is mono-exponential, so it can be measured at any time point after the peak and be adjusted by a constant factor. Panel c) The VolumeView™ algorithm relies on maximum up-slope (S1) and maximum down-slope (S2) of the dilution curve. This approach may be less sensitive to early recirculation and thermal noise.
Figure 2
Figure 2
Comparison of cardiac output measurements. Panel a) Correlation between measurements of cardiac output (CO) with the VolumeView™/EV1000™ system and reanalysis with the PiCCO2™ system. Panel b) Bland Altman Plot, with the difference between the values derived from the two algorithms plotted against their mean. The solid line represents bias, the two dashed lines the upper and lower limit of agreement. Panel c) Concordance plot of percentage change. Data points within the 10% exclusion zone are grayed out. Panel d) Polar plot with distance from the center as mean change and θ, the angle with the horizontal axis, as agreement. The dashed tram line intersects the 90° axis at ± 10% and marks the limit of acceptable concordance. The dotted lines mark the radial limits of agreement.
Figure 3
Figure 3
Comparison of global end-diastolic volume measurements. Panel a) Correlation between global end-diastolic volume (GEDV) computed with the PiCCO™ and the VolumeView™ algorithm. Panel b) Bland Altman Plot, with the difference between the values derived from the two algorithms plotted against their mean. The solid line represents bias, the two dashed lines the upper and lower limit of agreement. Panel c) Concordance plot of percentage change. Data points within the 10% exclusion zone are grayed out. Panel d) Polar plot with distance from the center as mean change and θ, the angle with the horizontal axis, as agreement. The dashed tram line intersects the 90° axis at ± 10% and marks the limit of acceptable concordance. The dotted lines mark the radial limits of agreement.
Figure 4
Figure 4
Comparison of extravascular lung water measurements. Panel a) Correlation between extravascular lung water computed with the PiCCO™ and the VolumeView™ algorithm. Panel b) Bland Altman Plot, with the difference between the values derived from the two algorithms plotted against their mean. The solid line represents bias, the two dashed lines upper and lower limit of agreement. Panel c) Concordance plot of percentage change. Data points within the 10% exclusion zone are grayed out. Panel d) Polar plot with distance from the center as mean change and θ, the angle with the horizontal axis, as agreement. The dashed tram line intersects the 90° axis at ± 10% and marks the limit of acceptable concordance. The dotted lines mark the radial limits of agreement.

Similar articles

Cited by

References

    1. Harvey S, Harrison DA, Singer M, Ashcroft J, Jones CM, Elbourne D, Brampton W, Williams D, Young D, Rowan K. Assessment of the clinical effectiveness of pulmonary artery catheters in management of patients in intensive care (PAC-Man): a randomised controlled trial. Lancet. 2005;366:472–477. doi: 10.1016/S0140-6736(05)67061-4. - DOI - PubMed
    1. Harvey S, Stevens K, Harrison D, Young D, Brampton W, McCabe C, Singer M, Rowan K. An evaluation of the clinical and cost-effectiveness of pulmonary artery catheters in patient management in intensive care: a systematic review and a randomised controlled trial. Health Technol Assess. 2006;10:1–133. - PubMed
    1. Rhodes A, Cusack RJ, Newman PJ, Grounds RM, Bennett ED. A randomised, controlled trial of the pulmonary artery catheter in critically ill patients. Intensive Care Med. 2002;28:256–264. doi: 10.1007/s00134-002-1206-9. - DOI - PubMed
    1. Koo KKY, Sun JCJ, Zhou Q, Guyatt G, Cook DJ, Walter SD, Meade MO. Pulmonary artery catheters: evolving rates and reasons for use. Crit Care Med. 2011;39:1613–1618. doi: 10.1097/CCM.0b013e318218a045. - DOI - PubMed
    1. Reuter DA, Huang C, Edrich T, Shernan SK, Eltzschig HK. Cardiac output monitoring using indicator-dilution techniques: basics, limits, and perspectives. Anesth Analg. 2010;110:799–811. doi: 10.1213/ANE.0b013e3181cc885a. - DOI - PubMed

Associated data