. 2012 Jun 12;109(24):9517-22.
doi: 10.1073/pnas.1119038109. Epub 2012 May 30.

Akt1 and Akt2 protein kinases differentially contribute to macrophage polarization

Affiliations

Akt1 and Akt2 protein kinases differentially contribute to macrophage polarization

Alicia Arranz et al. Proc Natl Acad Sci U S A. .

Abstract

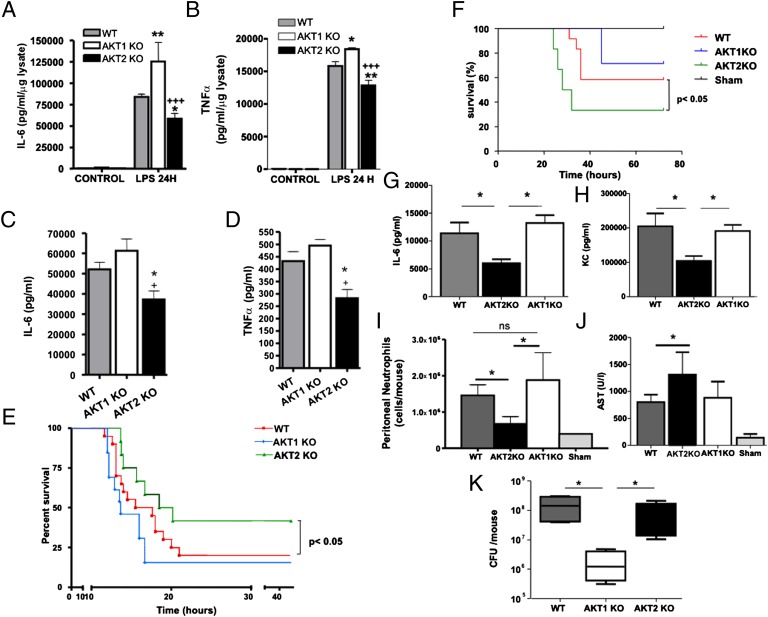
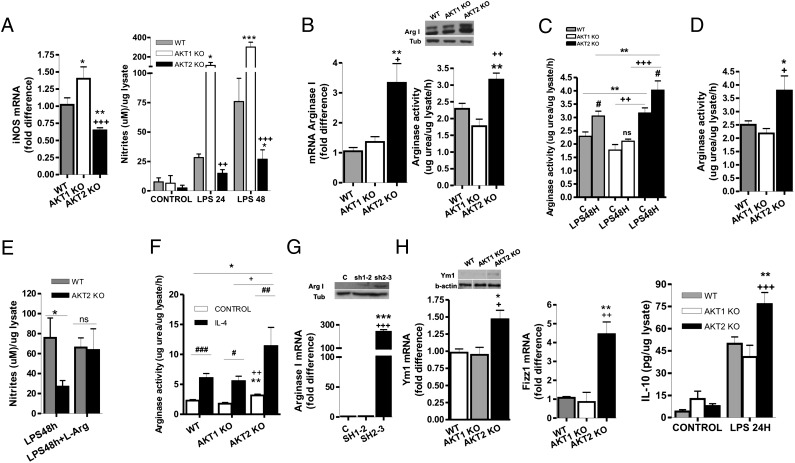
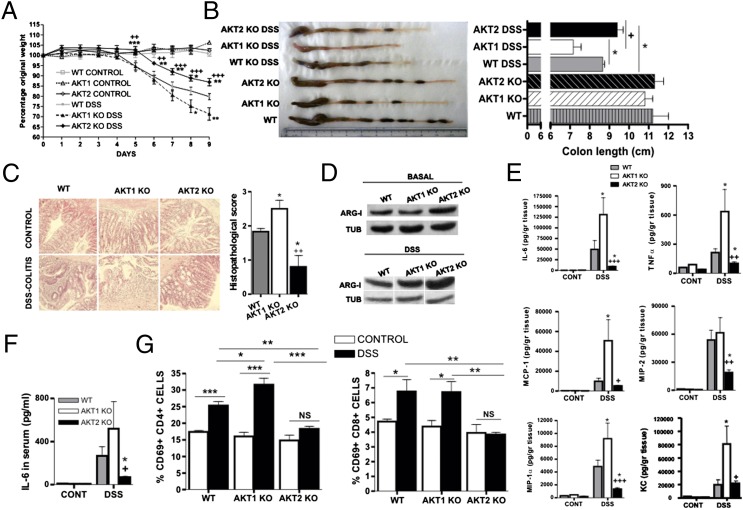
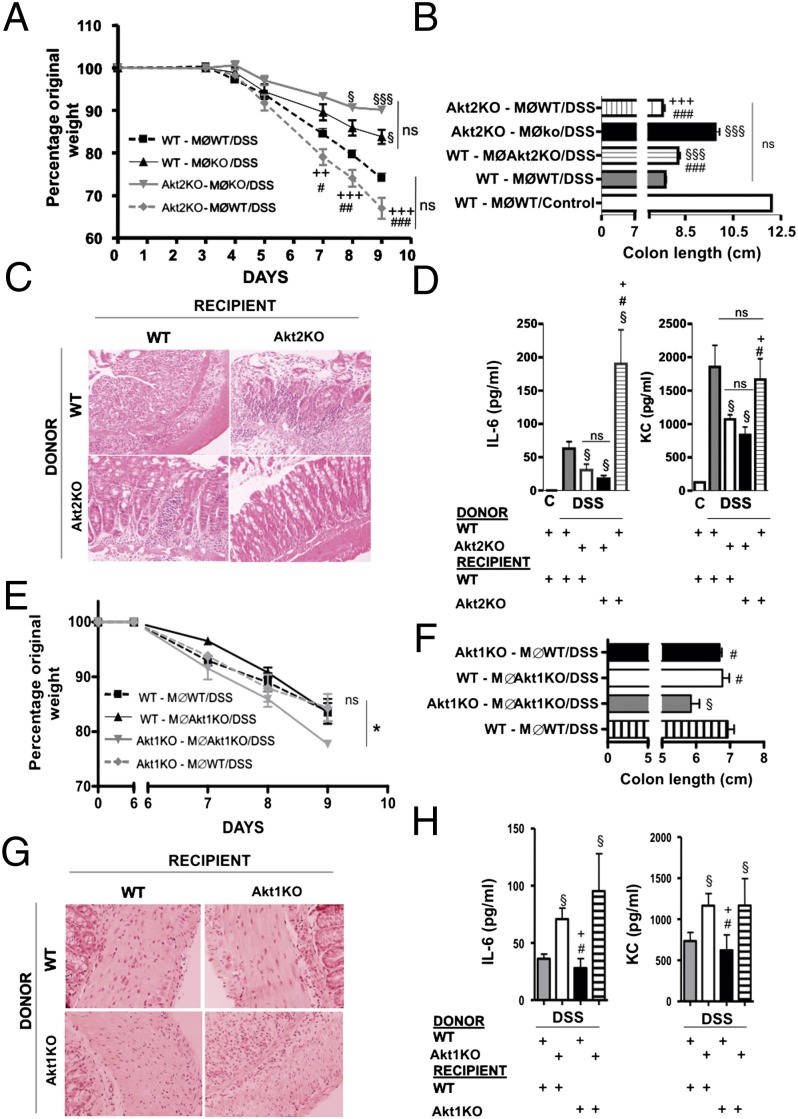
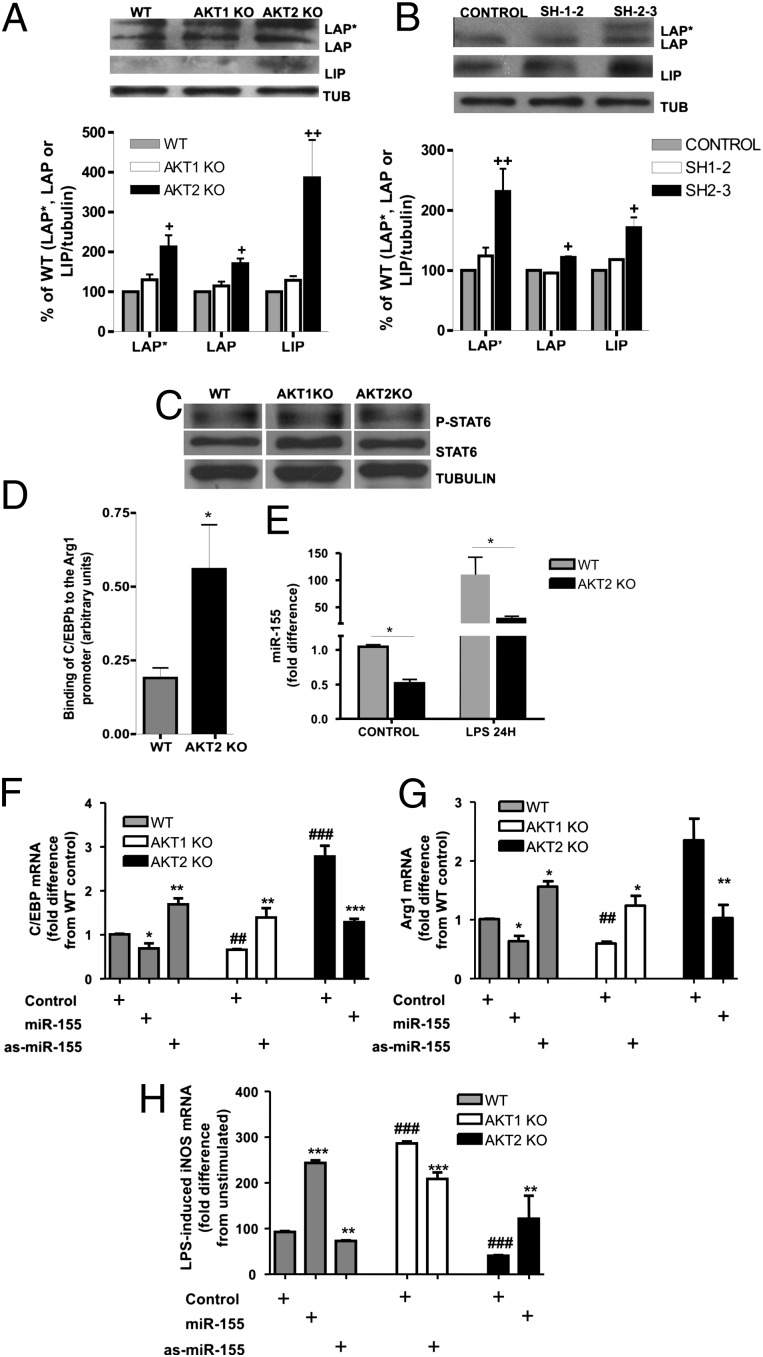
Activated macrophages are described as classically activated or M1 type and alternatively activated or M2 type, depending on their response to proinflammatory stimuli and the expression of genetic markers including iNOS, arginase1, Ym1, and Fizz1. Here we report that Akt kinases differentially contribute to macrophage polarization, with Akt1 ablation giving rise to an M1 and Akt2 ablation resulting in an M2 phenotype. Accordingly, Akt2(-/-) mice were more resistant to LPS-induced endotoxin shock and to dextran sulfate sodium (DSS)-induced colitis than wild-type mice, whereas Akt1(-/-) mice were more sensitive. Cell depletion and reconstitution experiments in a DSS-induced colitis model confirmed that the effect was macrophage-dependent. Gene-silencing studies showed that the M2 phenotype of Akt2(-/-) macrophages was cell autonomous. The microRNA miR-155, whose expression was repressed in naive and in LPS-stimulated Akt2(-/-) macrophages, and its target C/EBPβ appear to play a key role in this process. C/EBPβ, a hallmark of M2 macrophages that regulates Arg1, was up-regulated upon Akt2 ablation or silencing. Overexpression or silencing of miR-155 confirmed its central role in Akt isoform-dependent M1/M2 polarization of macrophages.


Conflict of interest statement

The authors declare no conflict of interest.

Figures

Fig. 1.
Fig. 1.
Depletion of Akt1 or Akt2 leads to distinct responses to LPS-induced septic shock or CLP-induced peritonitis. (A and B) IL-6 and TNFα were measured by ELISA in the supernatants of peritoneal macrophages from WT, Akt1−/−, and Akt2−/− mice stimulated 24 h with LPS. Results expressed as the mean ± SEM of data obtained from five independent experiments. (C and D) WT (n = 8), Akt1−/− (n = 8), and Akt2−/− mice (n = 8) were treated with 1.5 mg/25 g LPS. IL-6 and TNF-α levels were measured in serum at 6 h. (E) Survival of the mice was monitored. (F) WT (n = 9), Akt1−/− (n = 7), and Akt2−/− (n = 6) mice were subjected to CLP or sham operation (n = 4), and survival was monitored. (G and H) Serum IL-6 or KC was determined at 6 h following CLP. (I) Peritoneal lavage was collected 24 h following CLP (n = 5/group), and the number of neutrophils was measured. (J) AST was measured in the sera of mice subjected to CLP. (K) Akt1\x{2212}/\x{2212} mice had reduced bacterial burden in the peritoneal lavage fluid compared with WT or Akt2−/− ones, 24 h following CLP (n = 5/group). Results are expressed as the mean ± SEM. Comparison was made using an ANOVA test (AD and GK) and log-rank analysis (E and F).
Fig. 2.
Fig. 2.
Akt1−/− macrophages exhibit enhanced M1 response whereas Akt2−/− macrophages possess M2 phenotype. (A) iNOS mRNA levels and NO production in thioglycollate-elicited peritoneal macrophages stimulated for 24 or 48 h with LPS. (B) Arg1 mRNA and protein levels and activity were evaluated in thioglycollate-elicited peritoneal macrophages. (C and D) Arginase activity was measured after LPS stimulation for 48 h in peritoneal macrophages (C) and in primary non thioglycollate-elicited peritoneal macrophages (D). (E) Thioglycollate-elicited peritoneal macrophages were stimulated for 48 h with LPS in the presence or absence of 2 mM l-arginine, and NO production was determined. (F) Peritoneal macrophages were cultured in the presence or absence of IL-4 for 24 h and arginase activity was measured. (G) Raw264.7 cells were infected with a lentivirus-expressing empty vector, shAkt1 (sh1-2), or shAkt2 (sh2-3). mRNA and protein levels of Arg1 were analyzed. (H) Protein levels of Ym1, mRNA levels of Ym1 and Fizz1, and IL-10 production after 24 h of LPS stimulation were measured in thioglycollate-elicited peritoneal macrophages. Results are expressed as the mean ± SEM of three (D, E, G) or four (AC, F, H) independent experiments. Western blots are representative of at least three independent experiments. Comparisons were made using an ANOVA test.
Fig. 3.
Fig. 3.
Depletion of Akt2 results in reduced severity of DSS-induced colitis, whereas depletion of Akt1 results in exacerbation of the disease. (A) WT (n = 9), Akt1−/− (n = 9), and Akt2−/− (n = 9) mice were subjected to a DSS-colitis model. Results are expressed as percentage of initial weight. (B) Mice were euthanized at day 9, and colon length was measured. (C) Histopathological analysis and scoring was performed using colon samples. (D) Protein levels of Arg1 and (E) IL-6, TNFα, MCP1, MIP1α, MIP2, and KC were determined in colon samples. (F) Serum IL-6 and (G) the percentage of CD69+ cells from the CD4+ or the CD8+ populations in mesenteric lymph nodes were evaluated. Results are expressed as the mean ± SEM and as representative images and Western blot. Comparisons were made using ANOVA (A, C, E) or Student’s t (B, F, G) tests.
Fig. 4.
Fig. 4.
Protection from DSS colitis in Akt2−/− mice is due to the M2 phenotype of Akt2−/− macrophages whereas Akt1−/− macrophages are only partly responsible for the enhanced susceptibility of Akt1−/− mice to DSS colitis. Macrophages were depleted from WT (n = 8) and Akt2−/− mice (n = 8) and then reconstituted with WT macrophages or with Akt2−/− macrophages (four mice per group). (A) Body weight loss was monitored daily and following euthanasia at day 9 colon length (B), histological analysis (C), and IL-6 and KC levels in serum (D) were evaluated. In an independent experiment macrophages were depleted from WT (n = 10) and Akt1−/− (n = 10) and reconstituted with WT or Akt1−/− macrophages in all possible combinations (five mice per group). Weight loss (E), colon length (F), histology (G) and serum IL-6 and KC (H) were evaluated. Results are expressed as the mean ± SEM. Comparisons were made with ANOVA analysis (A) or with a Student’s t test (BD). MØ: macrophages. §P < 0.05 and §§§P <0.001 vs. WT animals reconstituted with WT macrophages. #P < 0.05, ##P <0.01, and ###P <0.001 vs. KO mice reconstituted with KO macrophages. +P < 0.05, ++P <0.01, and +++P <0.001 vs. WT mice reconstituted with KO macrophages.
Fig. 5.
Fig. 5.
The M2 phenotype in Akt2−/− macrophages was due to increased C/EBPβ expression, mediated by down-regulation of miR-155. (A) C/EBPβ (LAP*, LAP, and LIP isoforms) expression was analyzed by Western blot in peritoneal macrophages and (B) Raw264.7 cells transduced with empty vector, shAkt1 (sh1-2), or shAkt2 (sh2-3) constructs. (C) phospho-STAT6 (Tyr641) and total STAT6 expression levels were analyzed in peritoneal macrophages. (D) ChIP of C/EBPβ in WT and Akt2−/− macrophages and PCR quantification using primers flanking the C/EBPβ-binding element of the Arg1 promoter were performed. Results are shown as the ratio of target to input. (E) miR-155 expression was evaluated in LPS-stimulated (24 h) and unstimulated WT and Akt2−/− macrophages. (F and G) Expression of C/EBPβ (F) or Arg1 (G) was measured by real-time RT-PCR in macrophages transfected with miR-155 or as-miR-155 or scrambled RNA (control). (H) iNOS expression was measured by real-time RT-PCR in macrophages transfected with scrambled RNA (control), miR-155, or as-miR-155 and stimulated with LPS for 6 h. Results are expressed as the mean ± SEM of data obtained from at least three independent experiments. Western blots are representative of at least three independent experiments. Comparisons were made using Student’s t test. In (FH) *P < 0.05, **P < 0.01, ***P < 0.001 and #P < 0.05, ##P < 0.01, and ###P < 0.001 compared with the control of the same strain or the WT control, respectively.

Similar articles

Cited by

References

    1. Gordon S, Martinez FO. Alternative activation of macrophages: Mechanism and functions. Immunity. 2010;32:593–604. - PubMed
    1. Lawrence T, Natoli G. Transcriptional regulation of macrophage polarization: Enabling diversity with identity. Nat Rev Immunol. 2011;11:750–761. - PubMed
    1. Gray MJ, Poljakovic M, Kepka-Lenhart D, Morris SM., Jr Induction of arginase I transcription by IL-4 requires a composite DNA response element for STAT6 and C/EBPbeta. Gene. 2005;353:98–106. - PubMed
    1. Ruffell D, et al. A CREB-C/EBPbeta cascade induces M2 macrophage-specific gene expression and promotes muscle injury repair. Proc Natl Acad Sci USA. 2009;106:17475–17480. - PMC - PubMed
    1. Fernández-Hernando C, et al. Loss of Akt1 leads to severe atherosclerosis and occlusive coronary artery disease. Cell Metab. 2007;6:446–457. - PMC - PubMed

Publication types

Substances