. 2012 Jun 12;109(24):9593-8.
doi: 10.1073/pnas.1202910109. Epub 2012 May 30.

Infection of Epstein-Barr virus in a gastric carcinoma cell line induces anchorage independence and global changes in gene expression

Affiliations

Infection of Epstein-Barr virus in a gastric carcinoma cell line induces anchorage independence and global changes in gene expression

Aron R Marquitz et al. Proc Natl Acad Sci U S A. .

Abstract

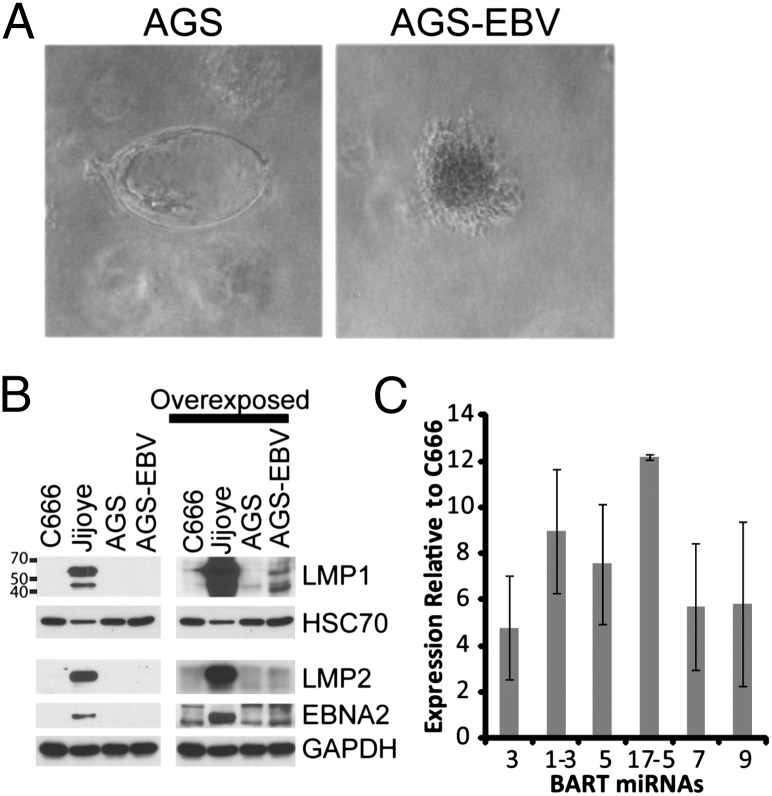
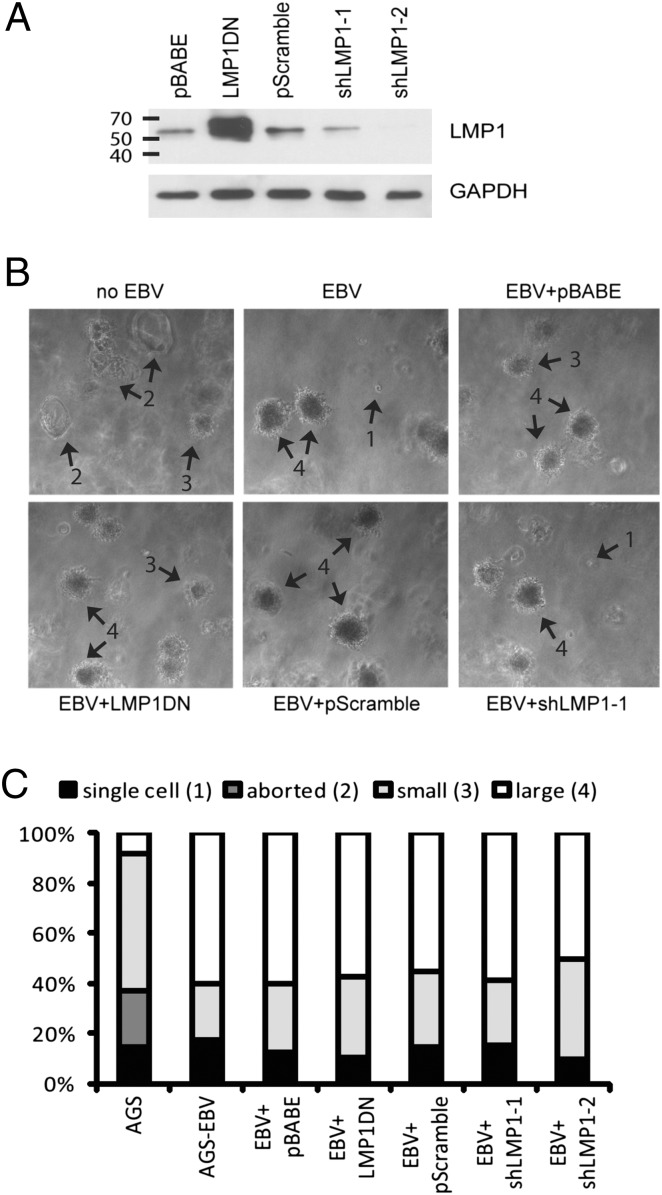
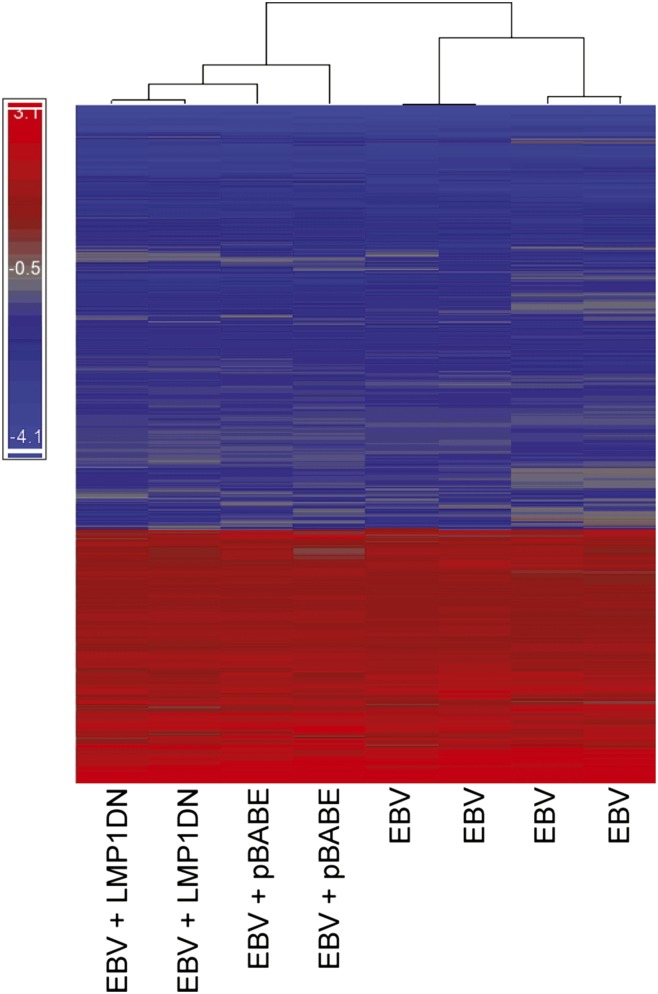
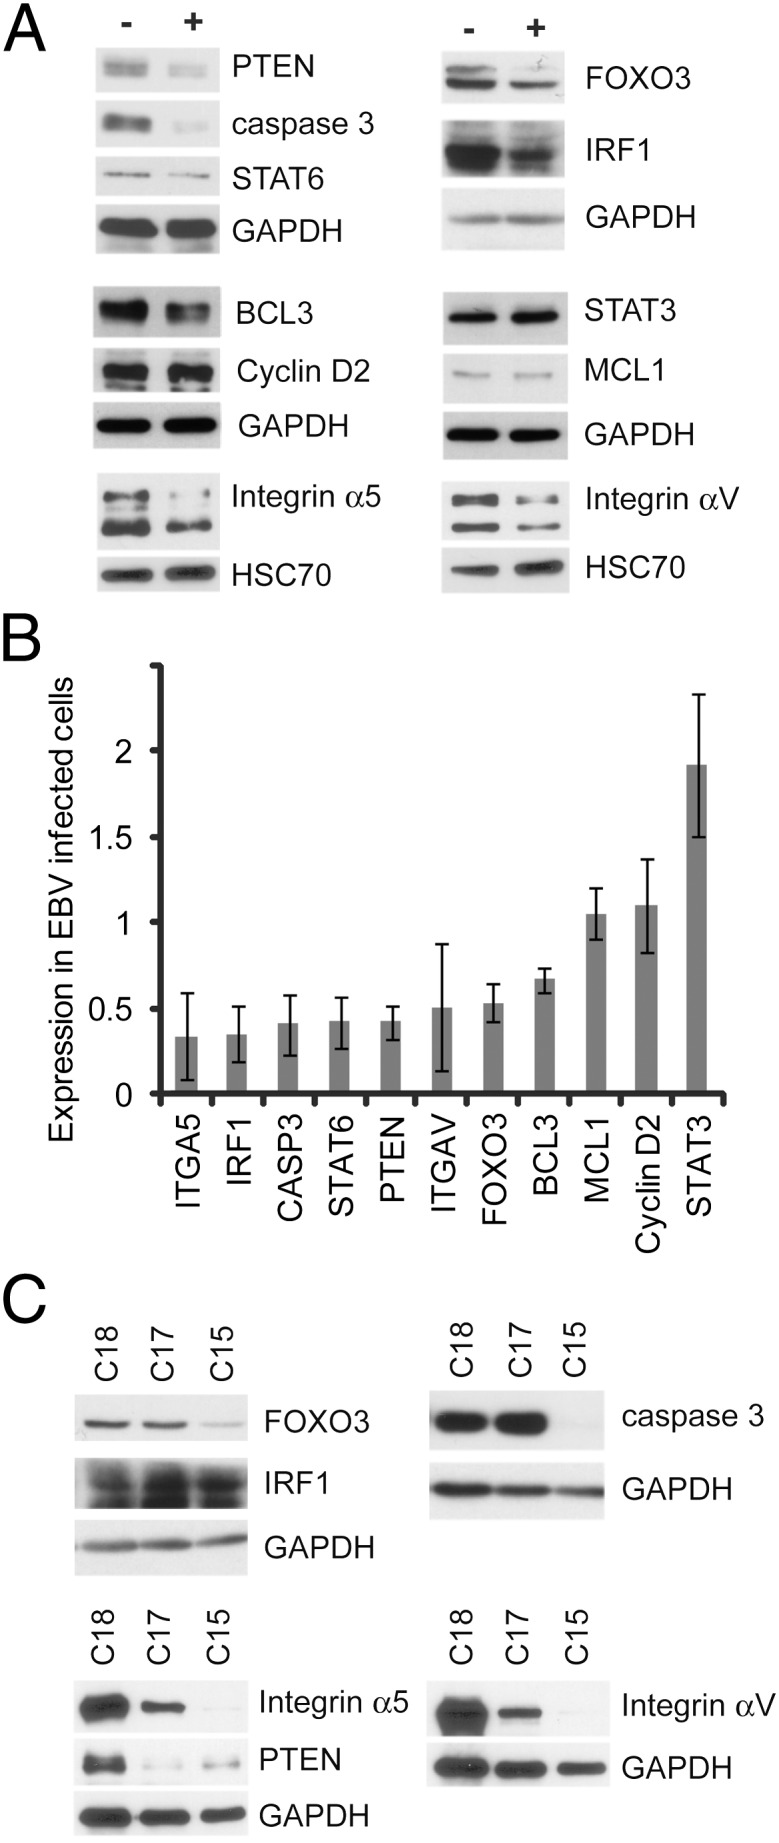
Latent infection of EBV is linked to the development of multiple cancers that have distinct patterns of expression of viral proteins and microRNAs (miRNAs). In this study, we show that in vitro infection of a gastric epithelial cell line with EBV alters growth properties and induces growth in soft agar. The infected cells have high levels of expression of a large cluster of viral miRNAs, [the BamHI A rightward transcript (BART) miRNAs] and limited viral protein expression. Expression profile microarray analysis of this cell line revealed a large number of changes in cellular expression, with decreased expression of many genes. Inhibition of the trace-expressed levels of the viral oncoprotein, latent membrane protein 1, did not affect growth or alter the pattern of cellular expression. The expression changes are highly enriched for genes involved in cell motility and transformation pathways, suggesting these changes are important for the altered growth phenotype. Importantly, the transcripts decreased by microarray are significantly enriched in both experimentally and bioinformatically predicted BART miRNA targets. The absence of viral protein expression and the enrichment for viral miRNA targets in the modulated cell genes suggest that the BART miRNAs are major contributors to the transformed growth properties of the EBV-infected cells. The ability to affect cell growth through miRNA expression without viral protein expression would be a major factor in the development of cancer in individuals with functional immune systems.


Conflict of interest statement

The authors declare no conflict of interest.

Figures

Fig. 1.
Fig. 1.
Phenotype and expression pattern of AGS cells infected with EBV. (A) AGS cells and AGS cells infected with EBV were grown in soft agar for 12 d. A representative colony from the infected cells compared with a picture of the aborted colonies from the uninfected cells is shown. The pictures as currently shown are at 100× magnification. (B) Expression of EBV latent proteins in AGS cells; AGS cells infected with EBV; Jijoye, a type III BL cell line; and C666-1, an NPC cell line. Expression of LMP1, LMP2, and EBNA2 by Western blotting is shown, with HSC70 and GAPDH used as loading controls (Left) or overexposed to show the small amount of LMP1 (Right) expressed in the AGS-EBV cells. (C) Quantitative RT-PCR for representative BART miRNAs in AGS-EBV cells. Plotted are the relative expression levels of each miRNA relative to the NPC cell line C666-1 from three independent experiments with the SEM indicated.
Fig. 2.
Fig. 2.
Inhibition of LMP1 through a DN or with shRNAs. (A) LMP1 expression in stable cell lines expressing a DN LMP1 (204-208AAAAA, Y384G), the pBABE vector control, two independent shRNAs targeted to LMP1, and a scrambled shRNA sequence used as a negative control. Shown is a long-exposure Western blot for LMP1, illustrating the large degree of overexpression of the DN construct over the endogenous LMP1 and knockdown by the shRNAs. GAPDH is used as a loading control. (B) Stable cell lines were grown in soft agar for 12 d. Arrows point to examples of the four classes of colonies scored below; single cell (1), aborted colony (2), small colony (3), and large colony (4). The pictures as currently shown are at 50× magnification. (C) Colonies in each soft agar assay were counted and classified based on the four categories shown above. At least 150 colonies for each genotype were counted.
Fig. 3.
Fig. 3.
Heat map of all genes changed at least twofold on the microarray. A cluster diagram of the 3,602 entities that were statistically significantly changed twofold across the eight microarrays as produced by Partek Genomics Suite software. Blue indicates down-regulation, and red indicates up-regulation. The bracket tree at the top of the diagram demonstrates the similarity between the array data as determined by the clustering algorithm, with the length of the vertical bars being proportional to the degree of dissimilarity. The two arrays from cells expressing the LMP1 DN construct cluster together and then cluster with the pBABE vector control arrays. The expression of the LMP1 DN did not affect the expression pattern of these genes compared with the other arrays.
Fig. 4.
Fig. 4.
Analysis of select genes shown to be down-regulated by microarray. (A) Western blot analysis of a group of genes down-regulated by microarray and predicted to be BART miRNA targets. Expression in AGS cells infected with EBV (+) is compared with that in noninfected AGS cells (−). GAPDH and HSC70 serve as loading controls. (B) Densitometry quantification of immunoblots for the indicated proteins. The ratio of the signal in infected cells vs. uninfected cells normalized to the loading control and averaged between at least three independent experiments is indicated with error bars representing the SEM. (C) Expression of the down-regulated proteins in protein lysates prepared from the NPC xenografts C15 (BART miRNA-positive) and C17 and C18 (BART miRNA-negative). GAPDH serves as the loading control.

References

    1. Rickinson AB, Kieff E. Epstein-Barr virus. In: Knipe DM, Howley PM, editors. Field’s Virology. 4th Ed. Philadelphia: Lippincott Williams & Wilkins; 2001. pp. 2575–2627.
    1. Raab-Traub N. Epstein-Barr virus in the pathogenesis of NPC. Semin Cancer Biol. 2002;12:431–441. - PubMed
    1. Rowe M, et al. Differences in B cell growth phenotype reflect novel patterns of Epstein-Barr virus latent gene expression in Burkitt’s lymphoma cells. EMBO J. 1987;6:2743–2751. - PMC - PubMed
    1. Lee HS, Chang MS, Yang HK, Lee BL, Kim WH. Epstein-barr virus-positive gastric carcinoma has a distinct protein expression profile in comparison with epstein-barr virus-negative carcinoma. Clin Cancer Res. 2004;10:1698–1705. - PubMed
    1. Gilligan K, et al. Novel transcription from the Epstein-Barr virus terminal EcoRI fragment, DIJhet, in a nasopharyngeal carcinoma. J Virol. 1990;64:4948–4956. - PMC - PubMed

Publication types

Associated data