

HTLV-1 modulates the frequency and phenotype of FoxP3+CD4+ T cells in virus-infected individuals
- PMID: 22647666
- PMCID: PMC3403885
- DOI: 10.1186/1742-4690-9-46
HTLV-1 modulates the frequency and phenotype of FoxP3+CD4+ T cells in virus-infected individuals
Abstract
Background: HTLV-1 utilizes CD4 T cells as the main host cell and maintains the proviral load via clonal proliferation of infected CD4+ T cells. Infection of CD4+ T cells by HTLV-1 is therefore thought to play a pivotal role in HTLV-1-related pathogenicity, including leukemia/lymphoma of CD4+ T cells and chronic inflammatory diseases. Recently, it has been reported that a proportion of HTLV-1 infected CD4+ T cells express FoxP3, a master molecule of regulatory T cells. However, crucial questions remain unanswered on the relationship between HTLV-1 infection and FoxP3 expression.
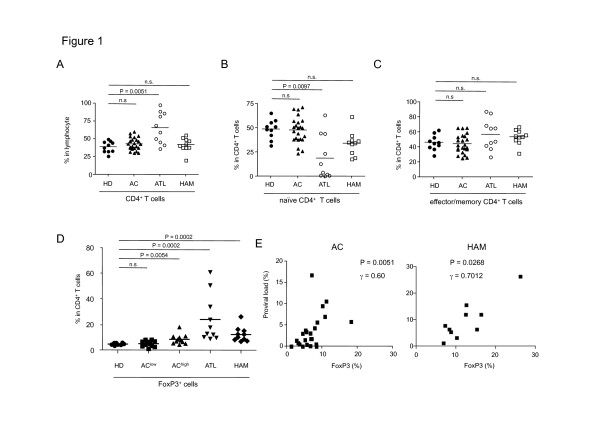
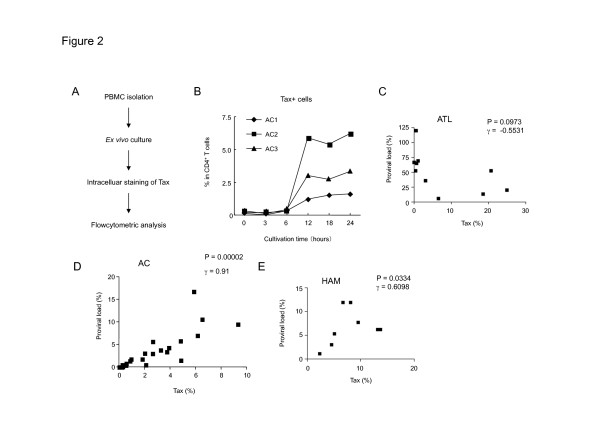
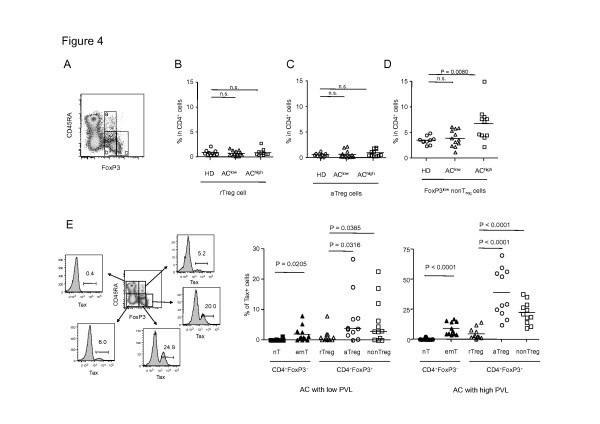
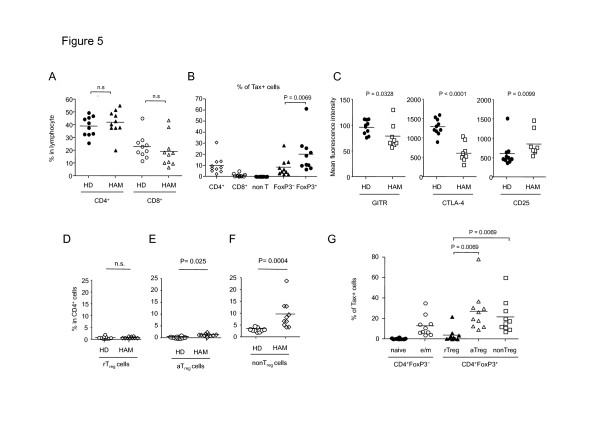
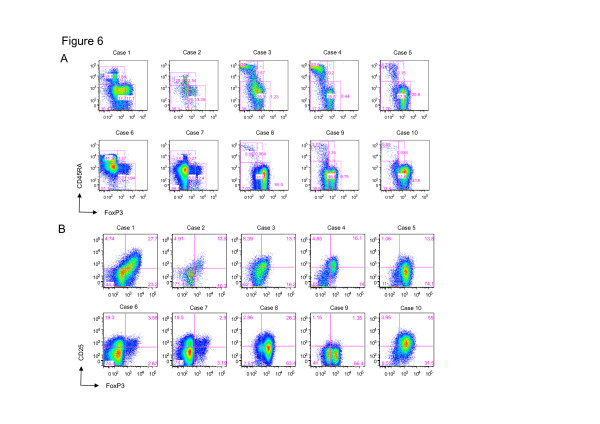
Results: To investigate the effect of HTLV-1 infection on CD4+ T-cell subsets, we used flow cytometry to analyze the T-cell phenotype and HTLV-1 infection in peripheral mononuclear cells (PBMCs) of four groups of subjects, including 23 HTLV-1-infected asymptomatic carriers (AC), 10 patients with HTLV-1 associated myelopathy/tropical spastic paraparesis (HAM/TSP), 10 patients with adult T-cell leukemia (ATL), and 10 healthy donors. The frequency of FoxP3+ cells in CD4+ T cells in AC with high proviral load and patients with HAM/TSP or ATL was higher than that in uninfected individuals. The proviral load was positively correlated with the percentage of CD4+ T cells that were FoxP3+. The CD4+FoxP3+ T cells, themselves, were frequently infected with HTLV-1. We conclude that FoxP3+ T- cells are disproportionately infected with HTLV-1 during chronic infection. We next focused on PBMCs of HAM/TSP patients. The expression levels of the Treg associated molecules CTLA-4 and GITR were decreased in CD4+FoxP3+ T cells. Further we characterized FoxP3+CD4+ T-cell subsets by staining CD45RA and FoxP3, which revealed an increase in CD45RA-FoxP3low non-suppressive T-cells. These findings can reconcile the inflammatory phenotype of HAM/TSP with the observed increase in frequency of FoxP3+ cells. Finally, we analyzed ATL cells and observed not only a high frequency of FoxP3 expression but also wide variation in FoxP3 expression level among individual cases.
Conclusions: HTLV-1 infection induces an abnormal frequency and phenotype of FoxP3+CD4+ T cells.
Figures

Similar articles
-
Evaluation of T Regulatory Lymphocytes Transcription Factors in HTLV-1-Associated Myelopathy/Tropical Spastic Paraparesis (HAM/TSP) Patients.Appl Biochem Biotechnol. 2017 Aug;182(4):1403-1414. doi: 10.1007/s12010-017-2406-7. Epub 2017 Jan 18. Appl Biochem Biotechnol. 2017. PMID: 28101786
-
In vivo fluctuation of Tax, Foxp3, CTLA-4, and GITR mRNA expression in CD4(+)CD25(+) T cells of patients with human T-lymphotropic virus type 1-associated myelopathy.Braz J Med Biol Res. 2010 Nov;43(11):1109-15. doi: 10.1590/s0100-879x2010007500107. Epub 2010 Oct 8. Braz J Med Biol Res. 2010. PMID: 20945034
-
The frequency of CD127low expressing CD4+CD25high T regulatory cells is inversely correlated with human T lymphotrophic virus type-1 (HTLV-1) proviral load in HTLV-1-infection and HTLV-1-associated myelopathy/tropical spastic paraparesis.BMC Immunol. 2008 Jul 29;9:41. doi: 10.1186/1471-2172-9-41. BMC Immunol. 2008. PMID: 18664281 Free PMC article.
-
Human T-lymphotropic virus type 1 (HTLV-1) and regulatory T cells in HTLV-1-associated neuroinflammatory disease.Viruses. 2011 Sep;3(9):1532-48. doi: 10.3390/v3091532. Epub 2011 Aug 25. Viruses. 2011. PMID: 21994794 Free PMC article. Review.
-
Human T-lymphotropic virus type 1 (HTLV-1) and cellular immune response in HTLV-1-associated myelopathy/tropical spastic paraparesis.J Neurovirol. 2020 Oct;26(5):652-663. doi: 10.1007/s13365-020-00881-w. Epub 2020 Jul 23. J Neurovirol. 2020. PMID: 32705480 Free PMC article. Review.
Cited by
-
Human T lymphotropic virus type 1 (HTLV-1) proviral load induces activation of T-lymphocytes in asymptomatic carriers.BMC Infect Dis. 2014 Aug 22;14:453. doi: 10.1186/1471-2334-14-453. BMC Infect Dis. 2014. PMID: 25148903 Free PMC article.
-
Spectrum of Treg and self-reactive T cells: single cell perspectives from old friend HTLV-1.Discov Immunol. 2024 May 13;3(1):kyae006. doi: 10.1093/discim/kyae006. eCollection 2024. Discov Immunol. 2024. PMID: 38863793 Free PMC article. Review.
-
Foxp3-dependent transformation of human primary CD4+ T lymphocytes by the retroviral protein tax.Biochem Biophys Res Commun. 2015 Oct 23;466(3):523-9. doi: 10.1016/j.bbrc.2015.09.063. Epub 2015 Sep 14. Biochem Biophys Res Commun. 2015. PMID: 26381169 Free PMC article.
-
Molecular mechanisms of viral oncogenesis in haematological malignancies: perspectives from metabolic reprogramming, epigenetic regulation and immune microenvironment remodeling.Exp Hematol Oncol. 2025 May 10;14(1):69. doi: 10.1186/s40164-025-00655-2. Exp Hematol Oncol. 2025. PMID: 40349096 Free PMC article. Review.
-
Peripheral T-cell and NK-cell lymphomas in the WHO classification: pearls and pitfalls.Mod Pathol. 2013 Jan;26 Suppl 1(Suppl 1):S71-87. doi: 10.1038/modpathol.2012.181. Mod Pathol. 2013. PMID: 23281437 Free PMC article. Review.
References
-
- Uchiyama T, Yodoi J, Sagawa K, Takatsuki K, Uchino H. Adult T-cell leukemia: clinical and hematologic features of 16 cases. Blood. 1977;50:481–492. - PubMed
-
- Gessain A, Barin F, Vernant JC, Gout O, Maurs L, Calender A, de The G. Antibodies to human T-lymphotropic virus type-I in patients with tropical spastic paraparesis. Lancet. 1985;2:407–410. - PubMed
Publication types
MeSH terms
Substances
LinkOut - more resources
Full Text Sources
Molecular Biology Databases
Research Materials
Miscellaneous
