. 2012 Jul 6;111(2):170-9.
doi: 10.1161/CIRCRESAHA.112.270041. Epub 2012 May 29.

Myofilament Ca sensitization increases cytosolic Ca binding affinity, alters intracellular Ca homeostasis, and causes pause-dependent Ca-triggered arrhythmia

Affiliations

Myofilament Ca sensitization increases cytosolic Ca binding affinity, alters intracellular Ca homeostasis, and causes pause-dependent Ca-triggered arrhythmia

Tilmann Schober et al. Circ Res. .

Abstract

Rationale: Ca binding to the troponin complex represents a major portion of cytosolic Ca buffering. Troponin mutations that increase myofilament Ca sensitivity are associated with familial hypertrophic cardiomyopathy and confer a high risk for sudden death. In mice, Ca sensitization causes ventricular arrhythmias, but the underlying mechanisms remain unclear.

Objective: To test the hypothesis that myofilament Ca sensitization increases cytosolic Ca buffering and to determine the resulting arrhythmogenic changes in Ca homeostasis in the intact mouse heart.

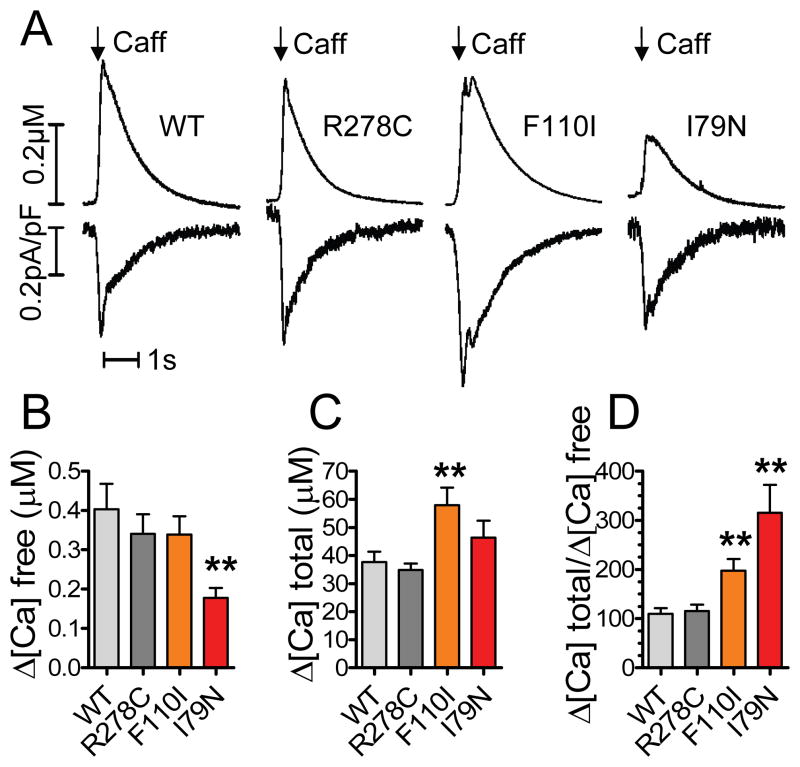
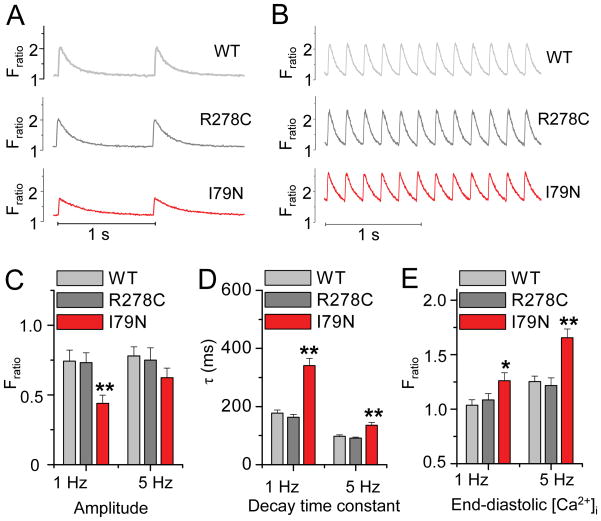
Methods and results: Using cardiomyocytes isolated from mice expressing troponin T (TnT) mutants (TnT-I79N, TnT-F110I, TnT-R278C), we found that increasing myofilament Ca sensitivity produced a proportional increase in cytosolic Ca binding. The underlying cause was an increase in the cytosolic Ca binding affinity, whereas maximal Ca binding capacity was unchanged. The effect was sufficiently large to alter Ca handling in intact mouse hearts at physiological heart rates, resulting in increased end-diastolic [Ca] at fast pacing rates, and enhanced sarcoplasmic reticulum Ca content and release after pauses. Accordingly, action potential (AP) regulation was altered, with postpause action potential prolongation, afterdepolarizations, and triggered activity. Acute Ca sensitization with EMD 57033 mimicked the effects of Ca-sensitizing TnT mutants and produced pause-dependent ventricular ectopy and sustained ventricular tachycardia after acute myocardial infarction.

Conclusions: Myofilament Ca sensitization increases cytosolic Ca binding affinity. A major proarrhythmic consequence is a pause-dependent potentiation of Ca release, action potential prolongation, and triggered activity. Increased cytosolic Ca binding represents a novel mechanism of pause-dependent arrhythmia that may be relevant for inherited and acquired cardiomyopathies.


Figures

Figure 1
Figure 1. Ca2+ sensitizing troponin T (TnT) mutants increase apparent cytosolic Ca2+ binding
Cytosolic Ca2+ fluorescence was recorded from voltage-clamped myocytes loaded with the fluorescent indicator Fluo-4 (25 μM). A, Representative examples of mice expressing either human wild-type cardiac TnT (WT) or mutant TnT (TnT-R278C, TnT-F110I, TnT-I79N). Myofilament Ca2+ sensitivity was altered in the following order: TnT-R278C≤TnT-WT<TnT-F110I<TnT-I79N. Upper trace: Rapidly applied caffeine was used to release Ca2+ from the sarcoplasmatic reticulum (SR). Lower trace: Integration of the Na+ Ca2+ exchanger current yielded the total amount of Ca2+ released from the SR. B–D, Myocytes expressing the Ca2+ sensitizing TnT mutants show a higher net cytosolic Ca2+ binding calculated by a smaller rise in [Ca2+]free and an higher Δ[Ca2+]total. n=11–13 myocytes per group. **p<0.01 vs WT and TnT-R278C
Figure 2
Figure 2. Ca2+ sensitizing TnT mutants alter the apparent Kd of cytosolic Ca2+ buffering
Cytosolic buffering parameters (Kd and Bmax) were determined using the Ca2+ binding data presented in Figure 1. Δ[Ca2+]total was plotted as a function of Δ[Ca2+]free, fitted to a modified Michaelis-Menten equation and Bmax and Kd calculated for each myocyte. A, Representative buffering plots. B–C, Ca2+ sensitizing TnT-I79N and TnT-F110I mutants show significantly lowered average Kd, but did not change maximal cytosolic buffering capacity (Bmax). The non-sensitizing TnT-R278C mutant was not different from wild-type (WT) myocytes. n=9–10 myocytes per group. **p<0.01 vs TnT-R278C and WT. D, Cytosolic buffering curves calculated from experimental Kd and Bmax obtained in B and C. E, Predicted cytosolic buffering capacity as a function of steady-state end-diastolic [Ca2+]free. A simulated twitch Ca2+ increase of 30 μM (= Δ[Ca2+]total) was used to compare buffering capacity in the four groups based on the buffering curves from D. The cytosolic buffering capacity decreases as end-diastolic [Ca2+]free increases. Note that at the same low diastolic Ca2+ this results in increased buffering capacity in the TnT-I79N (a vs. b) and therefore expected decreased systolic Ca2+. But buffering capacity can be the same in I79N and WT when diastolic [Ca2+] is different (a vs. c).
Figure 3
Figure 3. Ca2+ sensitized TnT-I79N myocytes exhibit prolonged Ca2+ transients and increased end-diastolic Ca2+ concentrations
Ca2+ transients were measures in field-stimulated ventricular myocytes, loaded with fura-2AM. A–B, Representative traces from three myocytes stimulated at 1 Hz (A) and 5 Hz (B). C–E, Average data. At 1 Hz, Ca2+ transients from the Ca2+ sensitized TnT-I79N myocytes have smaller amplitudes, slow decay kinetics and increased end-diastolic [Ca2+]. At a faster pacing rate of 5 Hz, the amplitude is nearly normalized, but decay kinetics remain significantly longer and end-diastolic [Ca2+] is further increased compared to both TnT-WT and TnT-R278C. *p<0.05, **p<0.01 compared to WT and R278C, n = 39–63 myocytes from 6–7 mice per group. Except for WT and R278C amplitude, all other parameter means measured at 5 Hz were significantly different from those measured at 1 Hz for each genotype (p<0.01, not indicated in the figure).
Figure 4
Figure 4. TnT-I79N hearts have increased Ca2+ transients in response to an extrastimulus after a pause
Ca2+ transients were measured from intact hearts using ratios of rhod-2 fluorescence. Hearts were subjected to rapid pacing at different pacing cycle length (S1), followed by a 1 second pause and an extrastimulus (S2 pulse). A, Representative trace demonstrating the pacing protocol, pacing cycle length 100 ms. B–F, Average data. Ca2+ removal from the cytosol is slowed (B) and end-diastolic Ca2+ concentrations are significantly increased in TnT-I79N (C). Ca2+ transients of TnT-I79N hearts have unchanged amplitude at steady state pacing (D), but show a significantly enhanced Ca2+ release after a pause (E, F). n=8–10 mice per group. *p<0.05, **p<0.01 TnT-I79N vs wild-type (WT).
Figure 5
Figure 5. SR Ca2+ content is increased in TnT-I79N myocytes after a pause
A, Experimental protocol. Voltage-clamped myocytes were stimulated with a pacing train (2 Hz, 20 s) of brief membrane depolarizations (0 mV, 50 ms) from a holding potential of − 70 mV. To measure end-diastolic SR Ca2+ content during steady-state pacing and after a pause, caffeine (10 mM) was applied either 0.5 s (= pacing cycle length) or 4 s following the last pacing stimulus. B, Representative NCX current records elicited by caffeine application. SR content was calculated from the NCX current integral. C, SR Ca2+ content is significantly increased in TnT-I79N vs TnT-WT myocytes only after a pause. N = 8–12 myocytes from 3–4 animals per genotype, *p<0.05.
Figure 6
Figure 6. Increasing Ca2+ sensitivity causes post-pause action potential prolongation
Hearts were subjected to rapid pacing (S1) at different pacing cycle length (PCL), followed by a 500 ms pause and an extrastimulus (S2). A, Example of spontaneous ventricular tachycardia (VT) in a TnT-I79N mouse after a pause following fast pacing. B, Representative examples of monophasic action potentials recorded during the stimulation protocol, PCL 100 ms. C and D, Ca2+ sensitized TnT-I79N hearts show rate-dependent AP prolongation after the pause. Panel D shows the relative post-pause APD90 (S2) compared to pre-pause APD90 (S1). N=5–8 mice per group. E and F, Acutely increased Ca2+ sensitivity with EMD (3 μM) also causes rate-dependent AP prolongation after pauses. n=4–11 mice per group. *p<0.05, **p<0.01.
Figure 7
Figure 7. Ca2+ sensitization causes early afterdepolarizations (EADs) and triggers premature beats after pauses
A, Pacing train with an extra stimulus (S2) after a 500 ms pause. Example record from a NTG heart treated with EMD (3 μM) shows an EAD followed by a triggered beat. Pacing cycle length (PCL) 100ms. B, At fast pacing rates, the incidence of EADs is increased in the Ca2+ sensitized TnT-I79N hearts. n = 4–11 mice per group. C, NTG hearts treated with EMD exhibit an increased rate of EADs compared to vehicle (VEH) treated NTG hearts and recordings after washout (WASH). n = 7–10 mice. D, In TnT-I79N hearts, the S2 beat frequently triggers premature beats. n = 4–11 mice per group. E, The incidence of triggered beats is increased by acute Ca2+ sensitization with EMD. n = 11–14 mice. *p<0.05, **p<0.01.
Figure 8
Figure 8. In hearts with acute MI, Ca2+ sensitization with EMD 57033 enhances post-pause Ca2+ transients and triggers sustained VT
A, upper panels: Representative examples of simultaneously recorded ECG and Ca2+ fluorescence traces in the presence of EMD (3 μM) or vehicle (VEH). Lower panels: Pause-dependent triggered beats and sustained VT in EMD-treated MI hearts. B–C, EMD slowed cytosolic Ca2+ removal and increased post-pause Ca2+ release. D, Compared to non-ischemic hearts (NTG), MI hearts exhibit an increased incidence of ectopic beats during steady state pacing, which is not affected by EMD. E, Acute MI by itself does not increase the occurrence of post-pause ectopic beats compared to NTG; MI hearts treated with EMD exhibit a 3-fold increase in post-pause triggered beats. F, EMD causes pause-triggered sustained VT in MI hearts. Black arrows: pacing stimuli. *p<0.05 compared to NTG+VEH, # p<0.05 and ## p<0.01 compared to both MI+VEH and NTG+VEH, n = 7–9 hearts per group.

References

    1. Marian AJ, Roberts R. The molecular genetic basis for hypertrophic cardiomyopathy. J Mol Cell Cardiol. 2001;33(4):655–670. - PMC - PubMed
    1. Maron BJ, Olivotto I, Spirito P, Casey SA, Bellone P, Gohman TE, Graham KJ, Burton DA, Cecchi F. Epidemiology of hypertrophic cardiomyopathy-related death: revisited in a large non-referral-based patient population. Circulation. 2000;102(8):858–864. - PubMed
    1. Maron BJ, Shen WK, Link MS, Epstein AE, Almquist AK, Daubert JP, Bardy GH, Favale S, Rea RF, Boriani G, Estes NA, 3rd, Spirito P. Efficacy of implantable cardioverter-defibrillators for the prevention of sudden death in patients with hypertrophic cardiomyopathy [see comments] N Engl J Med. 2000;342(6):365–373. - PubMed
    1. Spirito P, Bellone P, Harris KM, Bernabo P, Bruzzi P, Maron BJ. Magnitude of left ventricular hypertrophy and risk of sudden death in hypertrophic cardiomyopathy. N Engl J Med. 2000;342(24):1778–1785. - PubMed
    1. Varnava AM, Elliott PM, Baboonian C, Davison F, Davies MJ, McKenna WJ. Hypertrophic cardiomyopathy: histopathological features of sudden death in cardiac troponin T disease. Circulation. 2001;104(12):1380–1384. - PubMed

Publication types

MeSH terms