

Comprehensive evaluation of imputation performance in African Americans
- PMID: 22648186
- PMCID: PMC3477509
- DOI: 10.1038/jhg.2012.43
Comprehensive evaluation of imputation performance in African Americans
Abstract
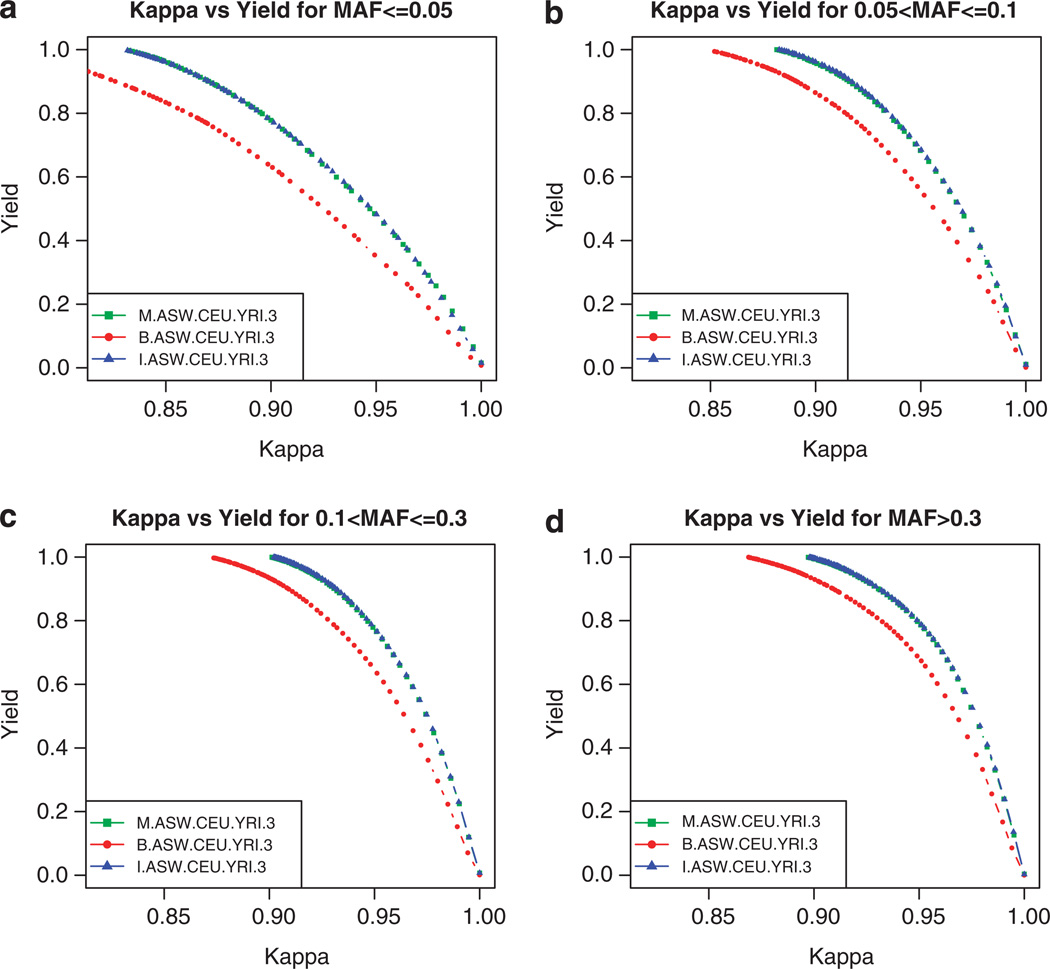
Imputation of genome-wide single-nucleotide polymorphism (SNP) arrays to a larger known reference panel of SNPs has become a standard and an essential part of genome-wide association studies. However, little is known about the behavior of imputation in African Americans with respect to the different imputation algorithms, the reference population(s) and the reference SNP panels used. Genome-wide SNP data (Affymetrix 6.0) from 3207 African American samples in the Atherosclerosis Risk in Communities Study (ARIC) was used to systematically evaluate imputation quality and yield. Imputation was performed with the imputation algorithms MACH, IMPUTE and BEAGLE using several combinations of three reference panels of HapMap III (ASW, YRI and CEU) and 1000 Genomes Project (pilot 1 YRI June 2010 release, EUR and AFR August 2010 and June 2011 releases) panels with SNP data on chromosomes 18, 20 and 22. About 10% of the directly genotyped SNPs from each chromosome were masked, and SNPs common between the reference panels were used for evaluating the imputation quality using two statistical metrics-concordance accuracy and Cohen's kappa (κ) coefficient. The dependencies of these metrics on the minor allele frequencies (MAF) and specific genotype categories (minor allele homozygotes, heterozygotes and major allele homozygotes) were thoroughly investigated to determine the best panel and method for imputation in African Americans. In addition, the power to detect imputed SNPs associated with simulated phenotypes was studied using the mean genotype of each masked SNP in the imputed data. Our results indicate that the genotype concordances after stratification into each genotype category and Cohen's κ coefficient are considerably better equipped to differentiate imputation performance compared with the traditionally used total concordance statistic, and both statistics improved with increasing MAF irrespective of the imputation method. We also find that both MACH and IMPUTE performed equally well and consistently better than BEAGLE irrespective of the reference panel used. Of the various combinations of reference panels, for both HapMap III and 1000 Genomes Project reference panels, the multi-ethnic panels had better imputation accuracy than those containing only single ethnic samples. The most recent 1000 Genomes Project release June 2011 had substantially higher number of imputed SNPs than HapMap III and performed as well or better than the best combined HapMap III reference panels and previous releases of the 1000 Genomes Project.
Figures


References
Publication types
MeSH terms
Grants and funding
- HHSN268201100009I/HL/NHLBI NIH HHS/United States
- R01 HL059367/HL/NHLBI NIH HHS/United States
- HHSN268201100007C/HL/NHLBI NIH HHS/United States
- HHSN268201100011I/HL/NHLBI NIH HHS/United States
- U01HG004402/HG/NHGRI NIH HHS/United States
- HHSN268201100006C/HL/NHLBI NIH HHS/United States
- R01HL087641/HL/NHLBI NIH HHS/United States
- HHSN268201100005I/HL/NHLBI NIH HHS/United States
- HHSN268201100007I/HL/NHLBI NIH HHS/United States
- R01 HL087641/HL/NHLBI NIH HHS/United States
- R01HL086694/HL/NHLBI NIH HHS/United States
- HHSN268201100012C/HL/NHLBI NIH HHS/United States
- UL1RR025005/RR/NCRR NIH HHS/United States
- R01HL59367/HL/NHLBI NIH HHS/United States
- HHSN268201100010C/HL/NHLBI NIH HHS/United States
- UL1 RR025005/RR/NCRR NIH HHS/United States
- HHSN268201100008C/HL/NHLBI NIH HHS/United States
- HHSN268201100005G/HL/NHLBI NIH HHS/United States
- HHSN268201100008I/HL/NHLBI NIH HHS/United States
- HHSN268201100011C/HL/NHLBI NIH HHS/United States
- R01 HL086694/HL/NHLBI NIH HHS/United States
- HHSN268200625226C/PHS HHS/United States
- U01 HG004402/HG/NHGRI NIH HHS/United States
- HHSN268201100009C/HL/NHLBI NIH HHS/United States
- HHSN268201100005C/HL/NHLBI NIH HHS/United States
LinkOut - more resources
Full Text Sources
Other Literature Sources