

The conductive hearing loss due to an experimentally induced middle ear effusion alters the interaural level and time difference cues to sound location
- PMID: 22648382
- PMCID: PMC3441957
- DOI: 10.1007/s10162-012-0335-2
The conductive hearing loss due to an experimentally induced middle ear effusion alters the interaural level and time difference cues to sound location
Abstract
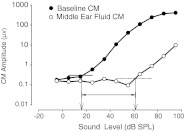
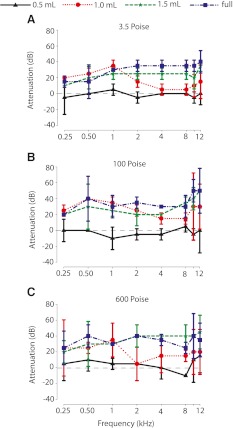
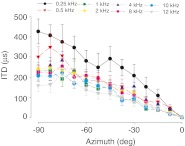
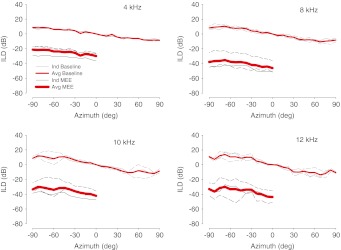
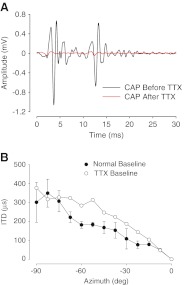
Otitis media with effusion (OME) is a pathologic condition of the middle ear that leads to a mild to moderate conductive hearing loss as a result of fluid in the middle ear. Recurring OME in children during the first few years of life has been shown to be associated with poor detection and recognition of sounds in noisy environments, hypothesized to result due to altered sound localization cues. To explore this hypothesis, we simulated a middle ear effusion by filling the middle ear space of chinchillas with different viscosities and volumes of silicone oil to simulate varying degrees of OME. While the effects of middle ear effusions on the interaural level difference (ILD) cue to location are known, little is known about whether and how middle ear effusions affect interaural time differences (ITDs). Cochlear microphonic amplitudes and phases were measured in response to sounds delivered from several locations in azimuth before and after filling the middle ear with fluid. Significant attenuations (20-40 dB) of sound were observed when the middle ear was filled with at least 1.0 ml of fluid with a viscosity of 3.5 Poise (P) or greater. As expected, ILDs were altered by ~30 dB. Additionally, ITDs were shifted by ~600 μs for low frequency stimuli (<4 kHz) due to a delay in the transmission of sound to the inner ear. The data show that in an experimental model of OME, ILDs and ITDs are shifted in the spatial direction of the ear without the experimental effusion.
Figures


Similar articles
-
Conductive hearing loss induced by experimental middle-ear effusion in a chinchilla model reveals impaired tympanic membrane-coupled ossicular chain movement.J Assoc Res Otolaryngol. 2013 Aug;14(4):451-64. doi: 10.1007/s10162-013-0388-x. Epub 2013 Apr 25. J Assoc Res Otolaryngol. 2013. PMID: 23615802 Free PMC article.
-
The effects of experimentally induced conductive hearing loss on spectral and temporal aspects of sound transmission through the ear.Hear Res. 2011 Feb;272(1-2):30-41. doi: 10.1016/j.heares.2010.11.003. Epub 2010 Nov 10. Hear Res. 2011. PMID: 21073935 Free PMC article.
-
Effects of conductive hearing loss on temporal aspects of sound transmission through the ear.Hear Res. 2003 Mar;177(1-2):53-60. doi: 10.1016/s0378-5955(02)00797-9. Hear Res. 2003. PMID: 12618317
-
The lateral superior olive: a functional role in sound source localization.Neuroscientist. 2003 Apr;9(2):127-43. doi: 10.1177/1073858403252228. Neuroscientist. 2003. PMID: 12708617 Review.
-
Sound localization.Handb Clin Neurol. 2015;129:99-116. doi: 10.1016/B978-0-444-62630-1.00006-8. Handb Clin Neurol. 2015. PMID: 25726265 Review.
Cited by
-
Improving the Differential Diagnosis of Otitis Media With Effusion Using Wideband Acoustic Immittance.Ear Hear. 2021 Sep/Oct;42(5):1183-1194. doi: 10.1097/AUD.0000000000001037. Ear Hear. 2021. PMID: 33928915 Free PMC article.
-
Chronic Conductive Hearing Loss Is Associated With Speech Intelligibility Deficits in Patients With Normal Bone Conduction Thresholds.Ear Hear. 2020 May/Jun;41(3):500-507. doi: 10.1097/AUD.0000000000000787. Ear Hear. 2020. PMID: 31490800 Free PMC article.
-
Temporary Unilateral Hearing Loss Impairs Spatial Auditory Information Processing in Neurons in the Central Auditory System.Front Neurosci. 2021 Nov 1;15:721922. doi: 10.3389/fnins.2021.721922. eCollection 2021. Front Neurosci. 2021. PMID: 34790088 Free PMC article.
-
Changes in Properties of Auditory Nerve Synapses following Conductive Hearing Loss.J Neurosci. 2017 Jan 11;37(2):323-332. doi: 10.1523/JNEUROSCI.0523-16.2016. J Neurosci. 2017. PMID: 28077712 Free PMC article.
-
Conductive hearing loss induced by experimental middle-ear effusion in a chinchilla model reveals impaired tympanic membrane-coupled ossicular chain movement.J Assoc Res Otolaryngol. 2013 Aug;14(4):451-64. doi: 10.1007/s10162-013-0388-x. Epub 2013 Apr 25. J Assoc Res Otolaryngol. 2013. PMID: 23615802 Free PMC article.
References
-
- Blauert J (1997) Spatial hearing: the psychophysics of human sound localization. MIT, Cambridge pp. 237–271
-
- Bluestone CD, Klein JO (eds) (1995) Definitions, terminology, and classification. In: Otitis media in infants and children (2nd Edn.). W.B. Saunders, Philadelphia, pp.1-3
Publication types
MeSH terms
Substances
Grants and funding
LinkOut - more resources
Full Text Sources
Research Materials
Miscellaneous
