. 2012 Aug;12(8):1077-89.
doi: 10.1002/mabi.201100501. Epub 2012 May 30.

Enzymatic mineralization of hydrogels for bone tissue engineering by incorporation of alkaline phosphatase

Affiliations

Enzymatic mineralization of hydrogels for bone tissue engineering by incorporation of alkaline phosphatase

Timothy E L Douglas et al. Macromol Biosci. 2012 Aug.

Abstract

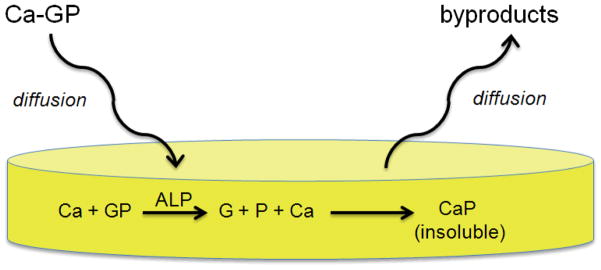
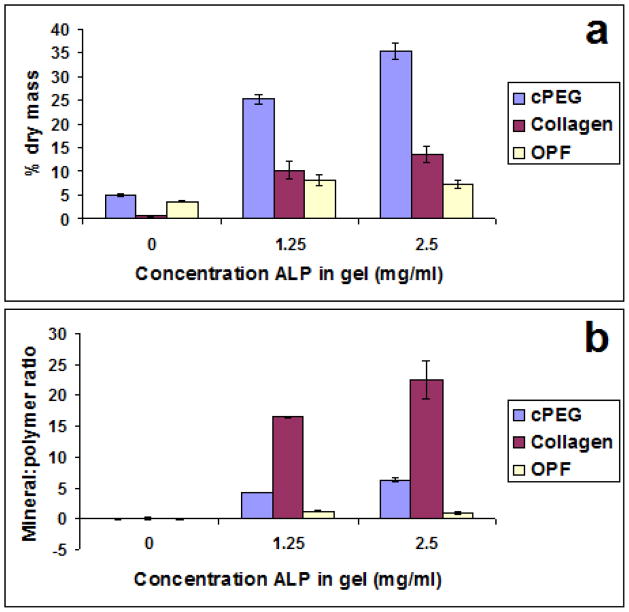
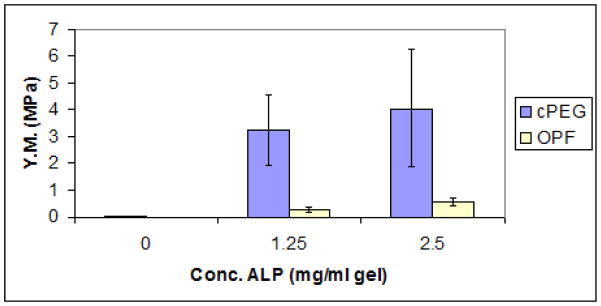
Alkaline phosphatase (ALP), an enzyme involved in mineralization of bone, is incorporated into three hydrogel biomaterials to induce their mineralization with calcium phosphate (CaP). These are collagen type I, a mussel-protein-inspired adhesive consisting of PEG substituted with catechol groups, cPEG, and the PEG/fumaric acid copolymer OPF. After incubation in Ca-GP solution, FTIR, EDS, SEM, XRD, SAED, ICP-OES, and von Kossa staining confirm CaP formation. The amount of mineral formed decreases in the order cPEG > collagen > OPF. The mineral:polymer ratio decreases in the order collagen > cPEG > OPF. Mineralization increases Young's modulus, most profoundly for cPEG. Such enzymatically mineralized hydrogel/CaP composites may find application as bone regeneration materials.


Figures

Figure 1
Figure 1
Basic principle of mineralization by enzymatic action of entrapped Alkaline Phosphatase (ALP). Calcium glycerophosphate (Ca-GP) diffuses into hydrogels with incorporated ALP. Inside the hydrogel, glycerophoshate (GP) is cleaved to phosphate (P) by ALP, which subsequently reacts with Ca2+ ions to form insoluble calcium phosphate (CaP) which remains inside the hydrogel.
Figure 2
Figure 2
Release of ALP from hydrogels. Top: with linear y-axis; bottom: logarithmic y-axis. Error bars show standard deviation.
Figure 3
Figure 3
FTIR spectra of freeze-dried hydrogels with ALP concentrations of 2.5 mg ml−1 (top, black) and 0 mg ml−1 (middle, blue) mineralized for 6 days. A spectrum of hydroxyapatite (green, bottom) is given as a reference. a: cPEG; b: collagen; c: OPF.
Figure 4
Figure 4
XRD spectra of freeze-dried cPEG (top) and collagen (bottom) hydrogels with ALP concentrations of 2.5 mg ml−1) mineralized for 6 days.
Figure 5
Figure 5
SAED diffractograms of freeze-dried hydrogels with ALP concentrations of 2.5 mg ml−1 mineralized for 6 days. Left: cPEG; middle: collagen; right: OPF.
Figure 6
Figure 6
EDS spectra of freeze-dried hydrogels containing ALP at concentrations of 0 (a, c, e) and 2.5 (b, d, f) mg ml−1 mineralized for 6 days. a, b: cPEG; c, d: collagen; e, f: OPF. Ka, Kb denote K-alpha and beta emissions, respectively.
Figure 7
Figure 7
SEM Images of freeze-dried hydrogels containing ALP at concentrations of 0 (a, c, e) and 2.5 (b, d, f) mg ml−1 mineralized for 6 days. a, b: cPEG; c, d: collagen; e, f: OPF. Cross-sectional images of cPEG (g) and OPF (h) containing 2.5 mg ml−1 ALP are also shown.
Figure 8
Figure 8
Von Kossa staining for phosphate deposits. Light microscopy images of stained cross-sections of gels containing ALP (a: cPEG; b: collagen; c: OPF) at a concentration of 2.5 mg ml−1 mineralized for 6 days. Black staining is characteristic for phosphate deposits.
Figure 9
Figure 9
a) Dry mass percentages of hydrogels with ALP concentrations of 0, 1.25 and 2.5 mg ml−1 mineralized for 6 days. Error bars show standard deviation. Significant differences (p < 0.01 in all cases): between 0 and 1.25 mg ml−1 for all hydrogels, between 1.25 and 2.5 mg ml−1 for cPEG and collagen. b) Mineral:polymer ratio in hydrogels at ALP concentrations of 0, 1.25 and 2.5 mg ml−1 after 6 days’ mineralization. Error bars show standard deviation.
Figure 10
Figure 10
Young’s modulus (Y. M.) of cPEG and OPF gels subjected to compressive testing after 6 days of enzymatic mineralization. Error bars show standard deviation. Significant differences (p < 0.01 in all cases): between cPEG and OPF at all ALP concentrations, between 0 and 1.25 mg ALP ml−1 gel for cPEG and OPF, between 1.25 and 2.5 mg ALP ml−1 gel for OPF only.
Figure 11
Figure 11
Measurement of storage modulus (G′) and loss modulus (G″) of cPEG (a), collagen (b) and OPF (c) hydrogels containing 0 and 2.5 mg ALP/ml gel after 2 and 6 days of enzymatic mineralization. Error bars show standard deviation. Significant differences: between 2 d 0 mg ml−1 and 2 d 2.5 mg ml−1: cPEG and OPF; between 6 d 0 mg ml−1 and 6 d 2.5 mg ml−1: all three materials; between 2 d 2.5 mg ml−1 and 6 d 2.5 mg ml −1: collagen only.

References

    1. Leeuwenburgh SC, Jansen JA, Mikos AG. J Biomater Sci Polym Ed. 2007;18:1547. - PubMed
    1. Leeuwenburgh SC, Ana ID, Jansen JA. Acta Biomater. 2010;6:836. - PubMed
    1. LeGeros RZ. Calcium Phosphates in Oral Biology and Medicine. Karger; Basel: 1991. - PubMed
    1. Ruhe PQ, Boerman OC, Russel FG, Spauwen PH, Mikos AG, Jansen JA. J Control Release. 2005;106:162. - PubMed
    1. Rowlands AS, George PA, Cooper-White JJ. Am J Physiol Cell Physiol. 2008;295:C1037. - PubMed

Publication types

MeSH terms

LinkOut - more resources