. 2012 Nov;22(11):2184-98.
doi: 10.1002/hipo.22038. Epub 2012 May 31.

Modulation by pregnenolone sulfate of filtering properties in the hippocampal trisynaptic circuit

Affiliations

Modulation by pregnenolone sulfate of filtering properties in the hippocampal trisynaptic circuit

Chessa S Scullin et al. Hippocampus. 2012 Nov.

Abstract

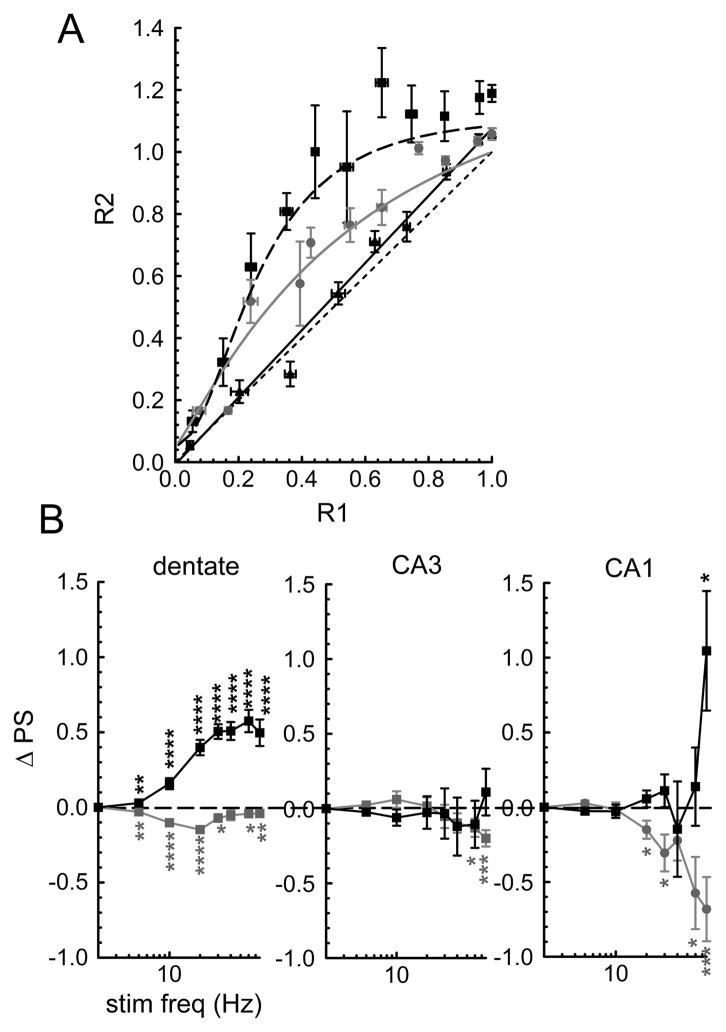
Short-term synaptic plasticity alters synaptic efficacy on a timescale that is relevant to encoding information in spike trains. The dynamics of this plasticity, combined with that of the feedback and feedforward contributions of local interneurons, impose frequency-dependent properties on neuronal networks with implications for nervous system function. The trisynaptic network of the hippocampus is especially well suited to selectively filter components of frequency-dependent signals that are transmitted from the entorhinal cortex. We measured presynaptic [Ca(2+)](i) in perforant path, mossy fiber, or Schaffer collateral terminals while simultaneously measuring field potentials of principal cells of the dentate, CA3, or CA1 synaptic fields over a range of stimulus frequencies of 2 to 77 Hz. In all three synaptic fields, the average [Ca(2+)](i) during a 500 ms stimulus train rose monotonically with stimulus frequency. The average population spike amplitude during this stimulus train, however, exhibited a non-linear relationship to frequency that was distinct for each of the three synaptic fields. The dentate synaptic field exhibited the characteristics of a low pass filter, while both CA synaptic fields had bandpass filter characteristics with a gain that was greater than 1 in the passband frequencies. Importantly, alteration of the dynamic properties of this network could significantly impact information processing performed by the hippocampus. Pregnenolone sulfate (PregS), has frequency-dependent effects on paired- and multipulse plasticity in the dentate and CA1 synaptic fields of the hippocampal formation. We investigated the PregS-dependent modulation of the dynamic properties of transmission by the principal cells of the three hippocampal synaptic fields. Importantly, PregS is capable of altering the pattern separation capabilities that may underlie hippocampal information processing.


Figures

Figure 1
Figure 1
Presynaptic ΔF/F0 and postsynaptic fEPSPs during fixed frequency 500 ms stimulus trains in three hippocampal synaptic fields. A. Representative traces at 2 Hz top and 30 Hz bottom. fEPSP traces, at expanded time scales, are shown for the first and last pulse at each frequency. B. Time course of normalized PS amplitude at 8 frequencies between 2 Hz and 77 Hz (see inset). For clarity, standard errors of the mean are shown for only the last time point. (dentate, n = 11; CA3, n = 17; CA1, n = 15.)
Figure 2
Figure 2
Frequency response relationships of each of the three hippocampal synaptic fields measured with fixed frequency stimulus trains. ΔF/F0 (A) and average PS amplitude (B) are shown for each of the three hippocampal synaptic fields. ΔF/F0 data are fit with a least squares linear regression (ΔF/F0 = a × Hz + b: dentate a = 0.016, b = 1.330, R2 = 0.674, n = 7; CA3 a = 0.027, b = 0.840, R2 = 0.990, n = 17; CA1 a = 0.032, b = 1.191, R2 = 0.970, n = 11). PS data are fit with a least squares regression to a low pass (equations 1 and 2, dentate) or bandpass (equations 1 and 3, CA3 and CA1) 3rd order Butterworth filter (see Methods). Dentate COF = 13.781 Hz, A = 0.179, R2 = 0.995, n = 9; CA3 CF = 12.292 Hz, BW = 21.272 Hz, A = 0.056, R2 = 0.941, n = 18; CA1 CF = 45.304 Hz, BW = 7.650 Hz, A = 0.024, R2 = 0.960, n = 16.
Figure 3
Figure 3
Frequency response relationships of each of the three hippocampal synaptic fields measured with random frequency stimulus trains. A. Exemplar portion of an 11 s PS record from the dentate. Note that PS amplitudes are larger following long intervals (low instantaneous frequency) than after short intervals (high instantaneous frequency). B. Data from the whole 11 s record from the dentate or similar records from the CA fields are fit with a least squares regression to a low pass (dentate, equations 1 and 2) or bandpass (CA3 and CA1, equations 1 and 3) 3rd order Butterworth filter (see Methods). Dentate: example, COF = 6.975, A= 0.159, R2 = 0.947; average for 3 slices COF = 9.748 ± 3.573 Hz. CA3: example, CF = 17.729 Hz, BW = 14.613 Hz, A = 0.0567, R2 = 0.811; average for 3 slices CF = 32.195 ± 17.383 Hz, BW = 21.839± 9.813 Hz; CA1: example, CF = 69.645 Hz, BW = 4.829 Hz, A = 0.0299, R2 = 0.865; average for 3 slices CF = 62.186 ± 5.108 Hz, BW = 11.272 ± 3.591 Hz.
Figure 4
Figure 4
Contribution of network inhibition to PS frequency response. A. First and last representative fEPSP traces during a 500 ms stimulus at 2 Hz (top) and 60 Hz (bottom) recorded in ACSF (gray) and in the same slice in 20 μM bicuculline (black). Note: As expected, bicuculline caused multiple PSs and measurements of PS amplitude were restricted to the first one following the stimulus artifact. B. Time course of the difference (bicuculline – ACSF) in individual slices between initial PS amplitude in ACSF and in 20 μM bicuculline at frequencies between 2 and 77 Hz (see inset). (dentate, n = 12; CA3, n = 12; CA1, n = 8.) C. Frequency response curves for PS amplitude in individual slices ACSF (gray) and bicuculline (black) during a 500 ms pulse train. D. Frequency dependency of differences in normalized PS amplitude for individual slices (bicuculline – ACSF). (One-way ANOVA with posthoc t-test against population mean of 0. Dentate: F(6,35) = 6.21, P =<0.0005, n = 12; CA3: F(7,40) = 0.71, P = 0.66, n = 12; CA1: F(7,24) = 1.72, P = 0.15, n = 8).
Figure 5
Figure 5
Effect of cumulative depression on PS frequency response. A. R1 vs. R2 PS amplitudes from input-output analyses at 50 ms interpulse interval in 20 μM bicuculline normalized to maximum value of R1 for each slice. Data are grouped in bins of 0.1 × R1 and average values ± s.e.m. are shown; however fits are to un-binned data. For the data from the dentate, there was no difference between the fits with the linear model (black solid line ▲, slope = 1.08 ± 0.0244, intercept = −0.00750 ± 0.01835) and the presynaptic model (comparison of fits: F(3,69) = 0.2522, P = 0.8589, Durbin Watson statistic = 2.236 indicates a lack of serial correlation, n = 10 slices). Data from CA3 were better fit with the presynaptic model (equations 4 and 5, table 1, gray solid line ●) than a linear model (comparison of fits F(3,61) = 6.290, P < 0.001, Durbin Watson statistic = 1.578 indicates a weak serial correlation suggesting linearity, n = 9 slices). Data from CA1 were better fit with the presynaptic model (equations 4 and 5, table 1, black dashed line ■) than with a linear model (comparison of fits: F(3,55) = 11.58, P < 0.0001, Durbin Watson statistic = 0.860 indicates a strong serial correlation, n = 8 slices). (Black dotted line indicates unity slope.) B. Frequency response curves for the difference between either the first PS in the train (PPF) (black) or the last PS in the train (gray) and the average PS amplitude during a 500 ms pulse train. (One-way ANOVA with posthoc t-test against population mean of 0. Dentate: PPF - average, F(7,79) = 18.17 P < .00001; end – average, F(7,79) = 6.01, P < 0.00001, n = 11; CA3, PPF – average, F(7,125) = 0.29, P=0.96, end – average F(7,125) = 2.40, P < 0.05, n = 17; CA1: PPF – average, F(7,108) = 3.34, P < 0.005, n = 15).
Figure 6
Figure 6
PS and ΔF/F0 response for three hippocampal synaptic fields in PregS. A. Representative traces at 2 Hz top and 30 Hz bottom in 1 μM PregS. PS traces at faster sweeps are shown for the first and last pulse at each frequency. B. ΔF/F0 data are fit with a least squares linear regression (ΔF/F0 = a × Hz + b: dentate, a = 0.024, b = 1.23, R2 = 0.913, n = 7; CA3, a = 0.036, b = 0.542, R2 = 0.970, n = 6, CA1, a = 0.028, b = 1.139, R2 = 0.970, n = 13). C. Time course of the difference between average PS amplitude in ACSF and the average PS amplitude in 1μM PregS at frequencies between 2 and 77 Hz (see inset).
Figure 7
Figure 7
Comparison of frequency responses in ACSF (gray ● and PregS black ■). PS data are fit with a least squares regression to a low pass (A, dentate) or bandpass (B, CA3 and C, CA1) 3rd order Butterworth filter (see Methods). Parameters for ACSF fits are given in figure 2. PregS fits: dentate, COF = 16.50, A = 0.246, R2 = 0.995, n = 12; CA3, CF = 14.868, BW = 27.40, A = 0.091, R2 = 0.809, n = 11; CA1, CF = 36.668, BW = 17.78, A = 0.055, R2 = 0.982, n = 13. Comparisons for drug effect at each frequency, 2-way ANOVA with Bonferroni posthoc. Dentate: drug effect F(1,148) = 2.96, P = −.087; frequency effect F(7,148) = 142.04, P< 0.001. CA3: drug effect F(1,206) = 15.07, P < 0.001; frequency effect F(7,206) = 3.27, P = 0.003. CA1: drug effect F(1,212) = 13.22, P< 0.001; frequency effect F(7,212) = 3.023, P = 0.005. D. Differences between fits for PregS and ACSF for dentate (black solid line), CA3 (gray solid line), and CA1 (black dashed line). (Because of negative values for some differences, these data are plotted with a linear ordinate scale.)

Similar articles

Cited by

References

    1. Ahmed OJ, Mehta MR. The hippocampal rate code: anatomy, physiology and theory. Trends Neurosci. 2009;32(6):329–38. - PMC - PubMed
    1. Andersen P. Organization of hippocampal neurons and their interconnections. In: Pribram RIK, editor. The Hippocampus Volume I: Structure and Development. New York: Plenum; 1975. pp. 155–175.
    1. Andersen P, Sundberg SH, Sveen O, Swann JW, Wigstrom H. Possible mechanisms for long-lasting potentiation of synaptic transmission in hippocampal slices from guinea-pigs. J Physiol. 1980;302:463–82. - PMC - PubMed
    1. Andersson R, Lindskog M, Fisahn A. Histamine H3 receptor activation decreases kainate-induced hippocampal gamma oscillations in vitro by action potential desynchronization in pyramidal neurons. J Physiol. 2010;588(Pt 8):1241–9. - PMC - PubMed
    1. Atluri PP, Regehr WG. Determinants of the time course of facilitation at the granule cell to Purkinje cell synapse. J Neurosci. 1996;16(18):5661–71. - PMC - PubMed

Publication types

MeSH terms