SPRY2 loss enhances ErbB trafficking and PI3K/AKT signalling to drive human and mouse prostate carcinogenesis
- PMID: 22649008
- PMCID: PMC3494076
- DOI: 10.1002/emmm.201100944
SPRY2 loss enhances ErbB trafficking and PI3K/AKT signalling to drive human and mouse prostate carcinogenesis
Abstract
Loss of SPRY2 and activation of receptor tyrosine kinases are common events in prostate cancer (PC). However, the molecular basis of their interaction and clinical impact remains to be fully examined. SPRY2 loss may functionally synergize with aberrant cellular signalling to drive PC and to promote treatment-resistant disease. Here, we report evidence for a positive feedback regulation of the ErbB-PI3K/AKT cascade by SPRY2 loss in in vitro as well as pre-clinical in vivo models and clinical PC. Reduction in SPRY2 expression resulted in hyper-activation of PI3K/AKT signalling to drive proliferation and invasion by enhanced internalization of EGFR/HER2 and their sustained signalling at the early endosome in a PTEN-dependent manner. This involved p38 MAPK activation by PI3K to facilitate clathrin-mediated ErbB receptor endocytosis. Finally, in vitro and in vivo inhibition of PI3K suppressed proliferation and invasion, supporting PI3K/AKT as a target for therapy particularly in patients with PTEN-haploinsufficient-, low SPRY2- and ErbB-expressing tumours. In conclusion, SPRY2 is an important tumour suppressor in PC since its loss drives the PI3K/AKT pathway via functional interaction with the ErbB system.
Copyright © 2012 EMBO Molecular Medicine.
Figures
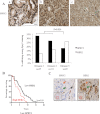
Representative images of SPRY2 immunostaining in Gleason grade 3–5 tumours (a–c, respectively; top panels). The percentages of tumours showing strong SPRY2 and HER2 expression (histoscore > 200) were categorized according to the Gleason grades (ranges 1–5): low grade, Gleason grades 1–3 (n = 37); intermediate grade, Gleason grade 4 (n = 111); high grade, Gleason grade 5 (n = 49; p = 0.034, n = 197 of 202 in TMA1).
Human TMA2 was stained for SPRY2 and HER2 immunoreactivity. In patients with low SPRY2, the samples were segregated according to their HER2 expression levels, and Kaplan–Meier curves of disease free survival were plotted (p = 0.0323).
Representative IHC images from the same case showing, respectively, high HER2 and loss of SPRY2 expression. The arrows indicate the corresponding tissues for HER2 and SPRY2 staining.
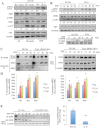
Serum starvation-primed cells were stimulated with heregulin (50 ng/ml) or EGF (20 ng/ml) for 15 min. Whole cell lysates were analysed by Western blotting. The levels of p-HER2 and p-AKT were quantified using Image J and the pixel intensities were normalized to that for Nsi control cells in serum free condition. The relative ratios and representative Western blots are shown (n = 3). SF, serum-free; CL, clone.
Cells were serum starved overnight and stimulated with EGF for varying durations, as indicated in the figure. The levels of p-HER2, p-AKT and p-EGFR were assayed. GAPDH expression was included as a loading control. The relative ratios of p-AKT and p-HER2 were quantified using Image J and the pixel intensities were normalized to that for Nsi control cells in serum free condition. The relative ratios and representative Western blots are shown (n = 3).
EGFR in SPRY2 KD and Nsi control DU145 cells was immunoprecipitated. The internalized biotin-EGFR population was detected with Streptavidin–horseradish peroxide. Cells were prepared by labelling surface proteins with NHS-S-S-biotin, followed by stimulation with EGF (for 0, 15, 30 and 60 min) and reduction of surface biotin prior to collection of cell lysates. HER2 and HER3 were detected by IP-western. At time 0 min (control), lysates were obtained without surface biotin reduction. For WCL (whole cell lysate) input, HER2, EGFR and GAPDH were blotted.
The percentages of internalized receptors for EGFR and HER2 were quantified and normalized to ‘total’ surface receptors (at 0 min) in DU145 Nsi control cells and SPRY2 KD clones (CL13 and CL61), respectively. EGF-induced receptor internalization in SPRY2 KD cells was significantly higher than that for Nsi control cells: EGFR internalization, *p = 0.02, 0.01 and 0.02 at 15, 30 and 60 min, respectively; HER2 internalization, *p = 0.02, 0.01 and 0.03 at 15, 30 and 60 min, respectively. All results are shown as mean values plus or minus (±) s.e.m from three-independent experiments and analysed by student's t-test.
Left panel: In parallel to internalization assay on PC3 cells, IP was performed as in Fig 2C, and lysates were blotted for biotin-EGFR with Streptavidin–horseradish peroxide. WCL inputs were collected and immunoblotted for EGFR and GAPDH. T, total surface EGFR; B, blank control from samples with reduced surface biotin, without EGF stimulation, i.e. no internalization. Right panel: EGFR mRNA levels were quantified in PC3 Nsi control and SPRY2 KD cells. The fold change in EGFR expression was normalized to GAPDH as a control (**p = 0.009, all results are shown as means ± SD from three-independent replicates and analysed by student's t-test).
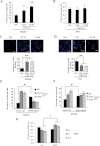
A,B. Serum-starved SPRY2 KD DU145 (panel A) and PC3 (panel B) cells were treated with EGF (20 ng/ml for 48 h) in a WST-1 growth assay. For DU145-derived cells, SPRY2 KD DU145 showed enhanced EGF induced growth: *p = 0.02 and **p = 0.007 for Cl13 and Cl61, respectively (n = 3). The percentage of increase in cell proliferation was derived from data normalized to serum free and EGF-free conditions for the respective cell line. All results are shown as means plus or minus (±) SD from three-independent experiments and student t-tests were performed.
C,D. Invasiveness of DU145- and PC3-derived SPRY2 KD and Nsi cells was quantified in the presence of EGF as a chemoattractant for 8 h. Cells were stained by DAPI and visualized using confocal microscope. **p = 0.002 for DU145 SPRY2 KD cells with increased invasion and **p = 0.001 for PC3 SPRY2 KD cells with reduced invasion (n = 3). In absence of EGF as chemo-attractant, we observed negligible numbers of invading cells. All results were shown as means ± SD (Scale bars = 100 µm). One-way ANOVA was performed.
E,F. SPRY2 KD and Nsi control DU145 were transfected with PTEN siRNA. The average numbers of invading cells through the matrigel plug are shown in panel E. For the WST-1 assay (F), data from individual cells were normalized to that of serum- and EGF-free medium control and the percentage increase in cell growth is shown. All results were shown as means ± SD (*p = 0.04 for invasion assay and *p = 0.03 WST-1 assay, n = 3 (student's t-test).
G. PTEN is ectopically expressed in PC3 Nsi control and SPRY2 KD cells. Cell growth was assayed and quantified using WST-1 assay (*p = 0.011, n = 3, one-way ANOVA). The percentage of increase in cell proliferation was derived from data normalized to serum- and EGF-free conditions for each cell line. All results were shown as means ± SD from three-independent replicates.
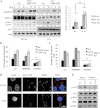
DU145- and PC3-derived Nsi control and SPRY2 KD cells were serum starved overnight and stimulated with EGF (20 ng/ml) for 15 and 30 min. Whole cell lysates were assessed using Western blotting. Actin was used as a loading control. Phosphorylation levels were quantified using Image J and the pixel intensities were normalized to that for Nsi control cells in serum- and EGF-free conditions. The relative ratios and representative Western blots are shown. Right panel shows the average relative ratios of p-AKT level in DU145 control Nsi and SPRY2 KD cells following EGF stimulation normalized to the respective serum free control cells (**p = 0.008, n = 3, one-way ANOVA), the results are shown as means ± s.e.m from three-independent experiments.
SPRY2 KD and Nsi control DU145 cells were treated with PD098059 (10 µM), LY294004 (10 µM) or DMSO as a vehicle control, and analysed for cell proliferation by the WST-1 assay (**p = 0.001, one-way ANOVA). The percentage of increase in cell growth was derived from data normalized to serum free control without EGF stimulation. All results are shown as means ± SD from three-independent replicates.
Invasiveness of SPRY2 KD and Nsi DU145 cells was quantified in the presence of EGF as a chemoattractant after 8 h incubation (**p = 0.002, n = 3, one-way ANOVA). The average number of cells observed per field is shown. All results were shown as means ± SD.
EEA1-GFP transfected cells were treated with dynasore (5 µM) in the presence of EGF. EGFR, GFP (EEA1-GFP) and DAPI were visualized (scale bar = 10 µm; Blue for DAPI staining, green for GFP-positive EEA1 staining and red for EGFR).
Cells were treated with dynasore (5 µM) in the presence of EGF. Whole cell lysates were collected and analysed by Western blotting as indicated. GAPDH was used as a loading control. p-AKT level was quantified using Image J and the pixel intensities were normalized to that for Nsi control cells in vehicle control condition. The average relative ratios and representative Western blots are shown.
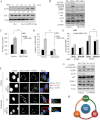
Serum starvation-primed SPRY2 KD and Nsi control DU145 cells were stimulated with EGF (20 ng/ml) for 15 min, and cell lysates were Western blotted with indicated antibodies. Actin was used as a loading control. p-p38 level was quantified using Image J and the pixel intensities were normalized to that for Nsi control cells in serum free condition. The relative ratios and representative Western blots are shown.
SPRY2 KD and Nsi control DU145 cells were pre-treated with either SB203580 (10 µM) or DMSO (vehicle control) for 6 h prior to EGF treatment (20 ng/ml and 15 min). Western blot analysis was carried out as in panel A.
EGF (48 h) mediated cell growth in DU145 derived cells was assayed with or without p38 inhibitor (SB203580, 10 µM) treatment (**p = 0.0003, n = 3, student's t-test). The results were shown as means ± SD. The percentage of increase in cell proliferation was derived from data normalized to serum free control for each cell line.
EGF (8 h, 20 ng/ml) mediated invasion in DU145 derived cells was assayed with or without p38 inhibitor (SB203580) pre-treatment (*p = 0.009, n = 3, student's t-test). The results are shown as means ± SD.
Internalized EGFR following EGF stimulation (15, 30 min) were quantified in SPRY2 KD and Nsi control DU145 cells with or without p38 inhibitor (SB203580) treatment (**p = 0.003, n = 3, student's t-test). The results were shown as means ± SD. The percentage of internalized EGFR was normalized to the total surface EGFR before EGF treatment.
Representative images of SPRY2 KD and Nsi control DU145 cells following EGF (20ng/ml, 30 min) stimulation with SB203580 or DMSO control. Merged images show EEA1-GFP (green), EGFR (red), and nuclei (blue; Scale bar = 10 µm).
SPRY2 KD and Nsi control DU145 cells were pre-treated with either LY294004 (10 µM) or DMSO for 6 h, and then stimulated by EGF (15 min, 20 ng/ml). Cell lysates were then analysed by Western blotting.
Schematic representation showing the positive feedback loop between EGFR, PI3K and p38 in SPRY2 loss background.

Representative tissue sections of H&E and Ki67 staining are shown. Prostate tissues were collected from Ptenfl/+ Spry2+/+ and Ptenfl/+ Spry2+/− mice (scale bar = 200 µm). Inserts show representative area at higher magnification
Representative images of SPRY2 expression in prostatic tissue sections from wild type (WT), Ptenfl/+ Spry2+/+ and Ptenfl/+ Spry2+/− mice are presented (scale bar = 200 µm). Insert shows representative area at higher magnification.
Representative IHC images of p-AKT and p-ERK1/2 staining in prostatic tissue sections from wild type (WT), Ptenfl/+ and Ptenfl/+ Spry2+/− mice are shown (scale bar = 200 µm). Inserts provide magnified view of area of interest.

Ptenfl/+ Spry2+/− mice (10–12 months) were treated with vehicle or PI103 (50 mg/kg) for 4 weeks, and the prostates were examined. The percentage of prostatic Ep cells per field positive for Ki67 expression was quantified and illustrated in the images (**p = 5.464E−05, n = 4, student's t-test). The results are shown as means ± s.e.m.
Representative tissue sections of H&E and immunostaining of indicated antibodies are shown (scale bar = 200 µm).
Representative Western blots of protein extracts on prostatic tissues from Ptenfl/+ Spry2+/ mice (10–12 months) following treatment with PI103 (50 mg/kg) or vehicle control. GAPDH was included as a loading control. p-AKT level was quantified using Image J and the pixel intensities were normalized to that for Nsi control cells in serum free condition. The relative ratios and representative Western blots are shown.
Enlarged lymph nodes were collected and representative images of H&E and BrdU staining were shown (scale bar = 200 µm). The table summarizes the incidence of detectable lymphatic metastasis following the two treatments.

References
-
- Bordoni V, Alonzi T, Zanetta L, Khouri D, Conti A, Corazzari M, Bertolini F, Antoniotti P, Pisani G, Tognoli F, et al. Hepatocyte-conditioned medium sustains endothelial differentiation of human hematopoietic-endothelial progenitors. Hepatology. 2007;45:1218–1228. - PubMed
Publication types
MeSH terms
Substances
Grants and funding
LinkOut - more resources
Full Text Sources
Medical
Molecular Biology Databases
Research Materials
Miscellaneous

