. 2012 Sep 1;40(17):e136.
doi: 10.1093/nar/gks454. Epub 2012 May 30.

Amplification-free whole-genome bisulfite sequencing by post-bisulfite adaptor tagging

Affiliations

Amplification-free whole-genome bisulfite sequencing by post-bisulfite adaptor tagging

Fumihito Miura et al. Nucleic Acids Res. .

Abstract

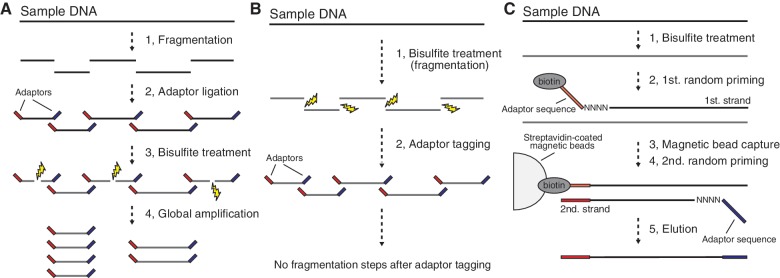
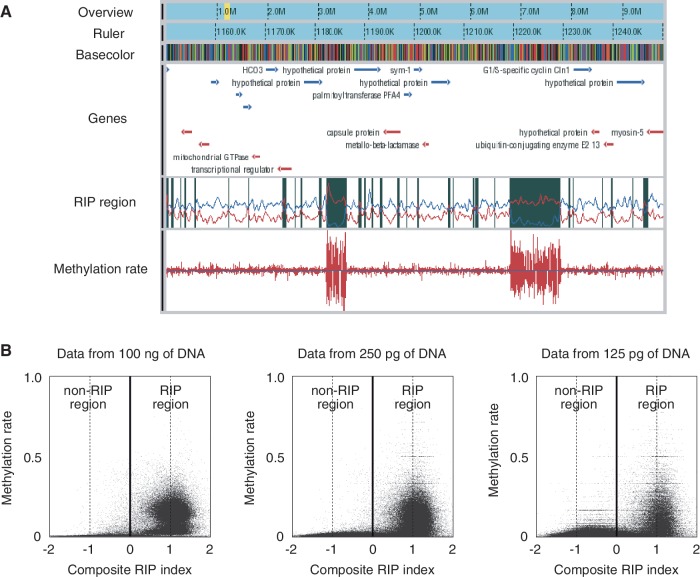
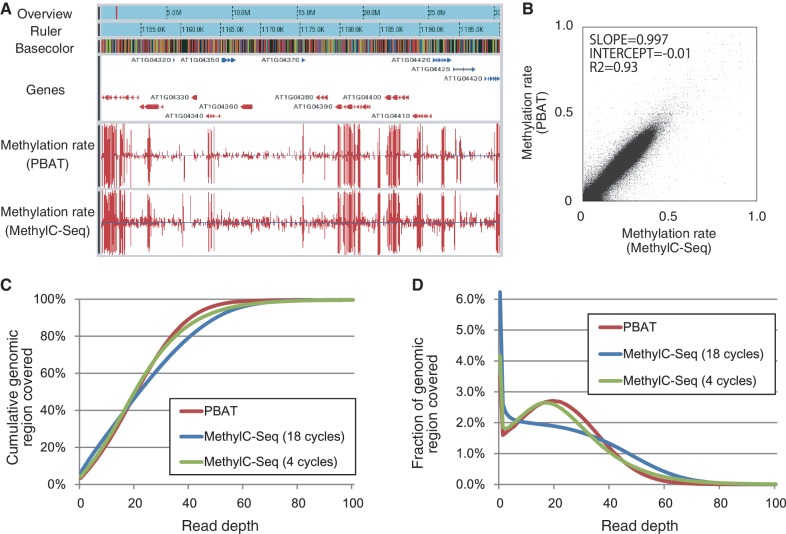
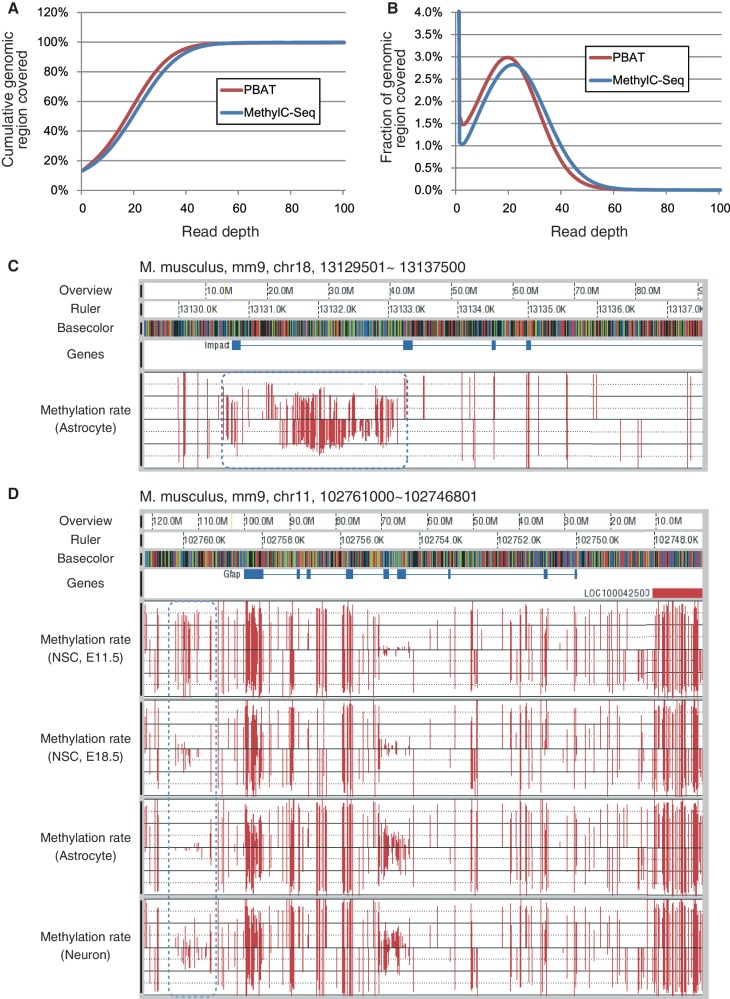
DNA methylation plays a key role in epigenetic regulation of eukaryotic genomes. Hence the genome-wide distribution of 5-methylcytosine, or the methylome, has been attracting intense attention. In recent years, whole-genome bisulfite sequencing (WGBS) has enabled methylome analysis at single-base resolution. However, WGBS typically requires microgram quantities of DNA as well as global PCR amplification, thereby precluding its application to samples of limited amounts. This is presumably because bisulfite treatment of adaptor-tagged templates, which is inherent to current WGBS methods, leads to substantial DNA fragmentation. To circumvent the bisulfite-induced loss of intact sequencing templates, we conceived an alternative method termed Post-Bisulfite Adaptor Tagging (PBAT) wherein bisulfite treatment precedes adaptor tagging by two rounds of random primer extension. The PBAT method can generate a substantial number of unamplified reads from as little as subnanogram quantities of DNA. It requires only 100 ng of DNA for amplification-free WGBS of mammalian genomes. Thus, the PBAT method will enable various novel applications that would not otherwise be possible, thereby contributing to the rapidly growing field of epigenomics.


Figures

Figure 1.
Figure 1.
WGBS and PBAT. (A) Schematic of the conventional WGBS protocols. Bisulfite treatment follows adaptor tagging, thereby leading to bisulfite-induced fragmentation of adaptor-tagged template DNAs. (B) Schematic of PBAT strategy. Bisulfite treatment precedes adaptor tagging, thereby circumventing bisulfite-induced fragmentation of adaptor-tagged template DNAs. (C) Random priming-mediated PBAT method. Two rounds of random priming on bisulfite-treated DNA generate directionally adaptor-tagged template DNAs.
Figure 2.
Figure 2.
WGBS of N. crassa by PBAT. (A) A snapshot of WGBS data obtained from 100 ng of DNA. The browser contains six tracks for overview, ruler, basecolor (nucleotide sequence), gene, RIP region and methylation rates from the top to the bottom. The yellow band in the overview track indicates the position of the region displayed in the other five tracks. Genes on the top and bottom strands are colored in blue and red, respectively. A RIP region colored in black in the RIP region track was defined as a region with a positive value of the composite RIP index obtained by subtracting the RIP substrate index (CpA + TpG/ApC + GpT, blue line plot in the track) from the RIP product index (TpA/ApT, red line plot in the track) (19). Methylation rates are indicated for both top and bottom DNA strands. Note that two large RIP regions are heavily methylated. (B) Cooccurrence of methylation and RIP. The moving averages (window size, 500 bp; step size, 100 bp) of methylation rate were plotted against those of the composite RIP index. WGBS data obtained from 100 ng and 250 and 125 pg of DNA were used for the analysis (Supplementary Table S1).
Figure 3.
Figure 3.
Comparison of A. thaliana WGBS data obtained by PBAT and MethylC-Seq. (A) A snapshot of WGBS data for seedlings of A. thaliana ecotype Col-0. The browser contains six tracks for overview, ruler, basecolor (nucleotide sequence), gene and methylation rates for the PBAT and MethylC-Seq data from the top to the bottom. The red band in the overview track indicates the position of the region displayed in the other five tracks. Genes on the top and bottom strands are colored in blue and red, respectively. The two bottom tracks display methylation rates for both strands calculated from the PBAT data obtained from 100 ng of DNA and the MethylC-Seq data obtained from 5 µg of DNA using 18 cycles of PCR enrichment (4). (B) Correlation between the PBAT and MethylC-Seq data. The moving averages (window size, 1000 bp; step size, 200 bp) of methylation rate were calculated from the two data sets and plotted for comparison. (C) Cumulative coverage of the A. thaliana genome by the PBAT and MethylC-Seq data (Supplementary Table S2). The percentage of the genome covered by differing maximum depth of reads is shown for the two data sets. The MethylC-Seq data on MA line 19 obtained from 2 µg of DNA using 4 cycles of PCR enrichment (20) is also included for comparison. (D) Coverage of the A. thaliana genome by the PBAT and MethylC-Seq data. The percentage of the genome covered at the indicated read depth is shown for the three data sets (Supplementary Table S2).
Figure 4.
Figure 4.
WGBS of mouse astrocyte by PBAT. (A) Cumulative coverage of the mouse genome by the PBAT data. The percentage of the genome covered by differing maximum depth of reads is shown. The PBAT data were obtained from 100 ng of astrocyte DNA without using any global PCR amplification (Supplementary Table S3). For comparison, cumulative coverage of the human genome by the MethylC-Seq data obtained from 5 µg of the IMR90 cell DNA with four cycles of PCR amplification (9) is also included (Supplementary Table S3). (B) Coverage of the mouse genome by the PBAT data. The percentage of the genome covered at the indicated read depth by the PBAT data is shown (Supplementary Table S3). For comparison, coverage of the human genome by the MethylC-Seq data (9) is also included (Supplementary Table S3). (C) Imprinted DMR of a paternally expressed gene Impact. The blue dotted round rectangle indicates methylation status of the DMR. The black horizontal lines in the methylation rate track indicate 50% methylation level for top and bottom strands of DNA. Note that apparently hemi-methylated stretches are derived from the regions with less than five reads, which were omitted from the calculation of methylation rates. (D) DMR in the upstream of Gfap gene. The blue dotted round rectangle indicates differential methylation among neural stem cells at embryonic day 11.5 and 18.5, astrocyte and neuron. Methylation rates were calculated for the cytosine residues covered by at least five reads.

References

    1. Harris RA, Wang T, Coarfa C, Nagarajan RP, Hong C, Downey SL, Johnson BE, Fouse SD, Delaney A, Zhao Y, et al. Comparison of sequencing-based methods to profile DNA methylation and identification of monoallelic epigenetic modifications. Nat. Biotechnol. 2010;28:1097–1105. - PMC - PubMed
    1. Bock C, Tomazou EM, Brinkman AB, Müller F, Simmer F, Gu H, Jäger N, Gnirke A, Stunnenberg HG, Meissner A. Quantitative comparison of genome-wide DNA methylation mapping technologies. Nat. Biotechnol. 2010;28:1106–1114. - PMC - PubMed
    1. Cokus SJ, Feng S, Zhang X, Chen Z, Merriman B, Haudenschild CD, Pradhan S, Nelson SF, Pellegrini M, Jacobsen SE. Shotgun bisulphite sequencing of the Arabidopsis genome reveals DNA methylation patterning. Nature. 2008;452:215–219. - PMC - PubMed
    1. Lister R, O’Malley RC, Tonti-Filippini J, Gregory BD, Berry CC, Millar AH, Ecker JR. Highly integrated single-base resolution maps of the epigenome in Arabidopsis. Cell. 2008;133:523–536. - PMC - PubMed
    1. Xiang H, Zhu J, Chen Q, Dai F, Li X, Li M, Zhang H, Zhang G, Li D, Dong Y, et al. Single base-resolution methylome of the silkworm reveals a sparse epigenomic map. Nat. Biotechnol. 2010;28:516–520. - PubMed

Publication types