. 2012 Aug;191(4):1143-55.
doi: 10.1534/genetics.112.140954. Epub 2012 May 29.

Comparing enhancer action in cis and in trans

Affiliations

Comparing enhancer action in cis and in trans

Jack R Bateman et al. Genetics. 2012 Aug.

Abstract

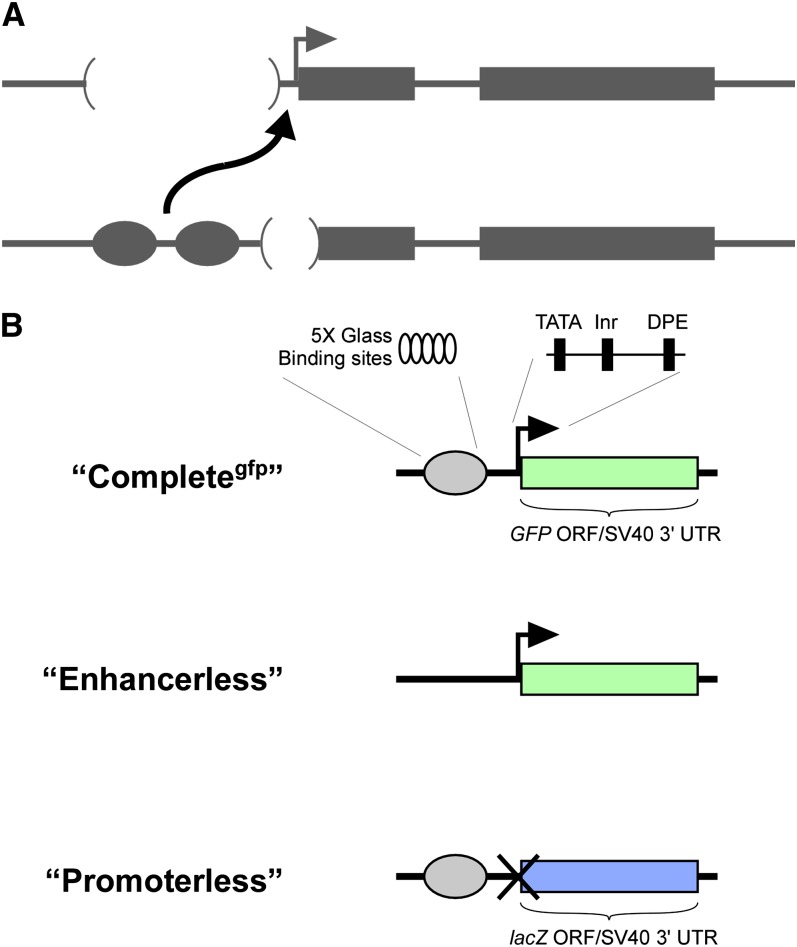
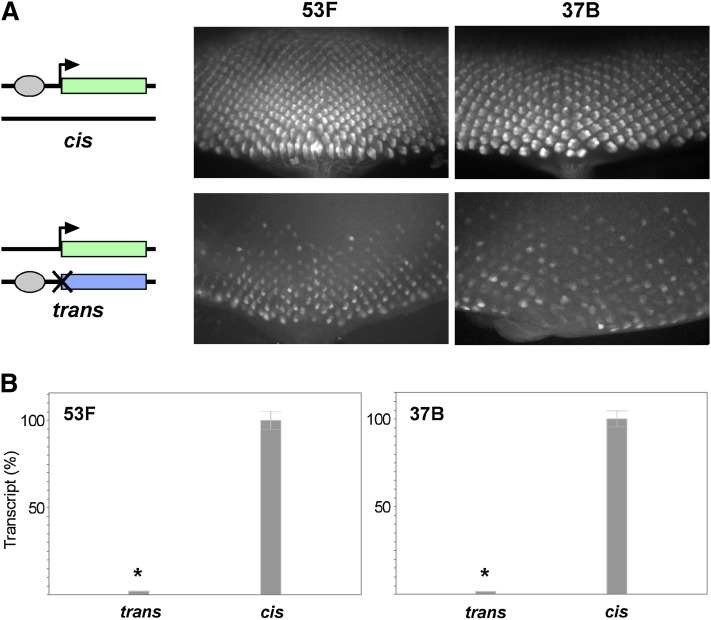
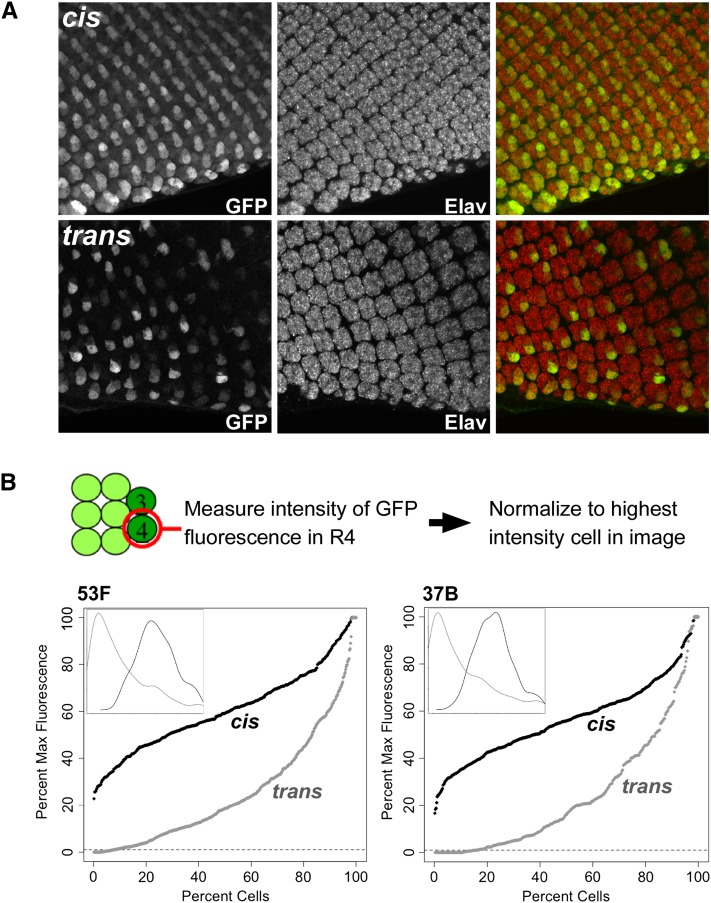
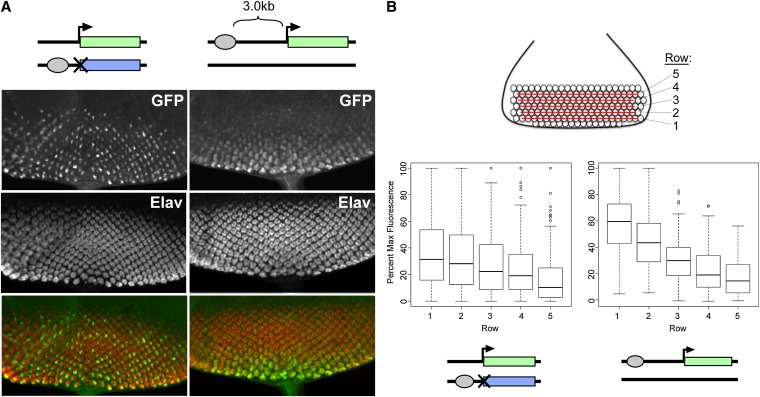
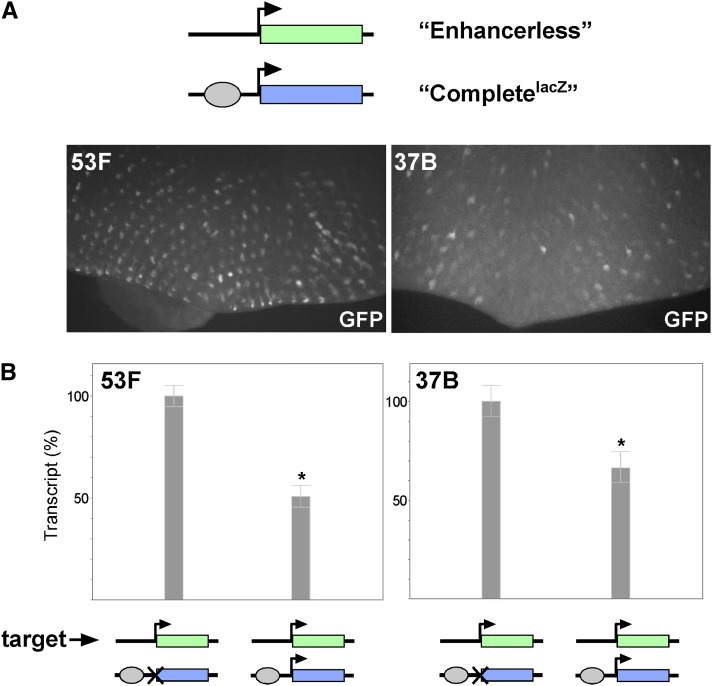
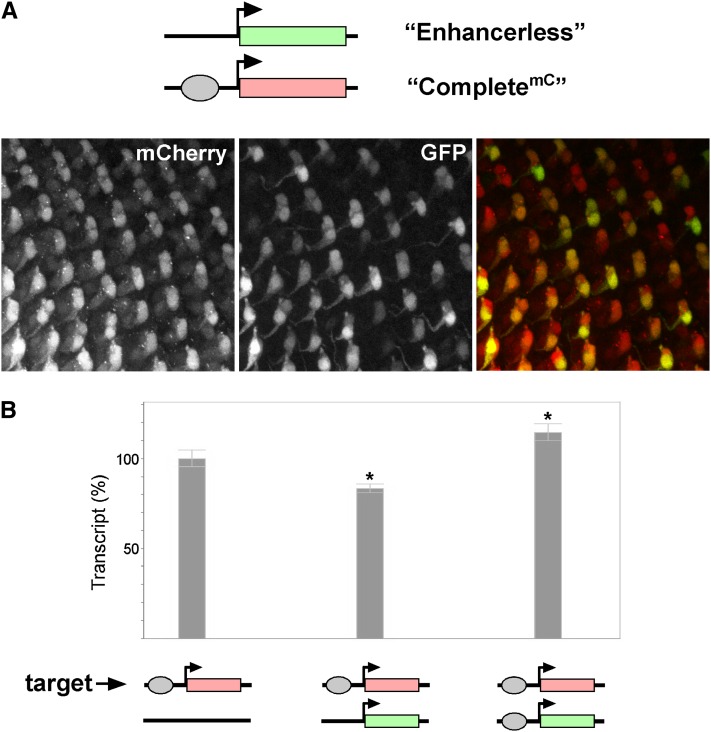
Studies from diverse systems have shown that distinct interchromosomal interactions are a central component of nuclear organization. In some cases, these interactions allow an enhancer to act in trans, modulating the expression of a gene encoded on a separate chromosome held in close proximity. Despite recent advances in uncovering such phenomena, our understanding of how a regulatory element acts on another chromosome remains incomplete. Here, we describe a transgenic approach to better understand enhancer action in trans in Drosophila melanogaster. Using phiC31-based recombinase-mediated cassette exchange (RMCE), we placed transgenes carrying combinations of the simple enhancer GMR, a minimal promoter, and different fluorescent reporters at equivalent positions on homologous chromosomes so that they would pair via the endogenous somatic pairing machinery of Drosophila. Our data demonstrate that the enhancer GMR is capable of activating a promoter in trans and does so in a variegated pattern, suggesting stochastic interactions between the enhancer and the promoter when they are carried on separate chromosomes. Furthermore, we quantitatively assessed the impact of two concurrent promoter targets in cis and in trans to GMR, demonstrating that each promoter is capable of competing for the enhancer's activity, with the presence of one negatively affecting expression from the other. Finally, the single-cell resolution afforded by our approach allowed us to show that promoters in cis and in trans to GMR can both be activated in the same nucleus, implying that a single enhancer can share its activity between multiple promoter targets carried on separate chromosomes.


Figures

Figure 1
Figure 1
Schematic view of constructs used to establish a transgenic system for transvection. (A) A schematic of typical alleles that show transvection at endogenous genes. In the top allele, the enhancers (circles) are deleted, while in the bottom allele, the promoter (bent arrow) is deleted. When paired, the remaining enhancers of the bottom allele act in trans (curved arrow) on the intact promoter of the top allele. Boxes represent exons, and straight lines represent chromosomal DNA. (B) Schematic view of transgenic constructs inspired by the alleles in A. Completegfp carries the GMR enhancer (gray oval), consisting of five tandem Glass binding sites, the hsp70 promoter (black bent arrow), which has TATA, Inr, and DPE core promoter elements, and a transcriptional region consisting of a GFP ORF fused to the SV40 3′-UTR (green box). The Enhancerless construct is identical to Completegfp with the omission of GMR sequences. The Promoterless construct carries GMR, with no promoter (indicated by an uppercase X), and replaces the GFP ORF with that of lacZ (blue box). All three constructs are flanked by phiC31 attB sites to allow for site-specific transformation via RMCE.
Figure 2
Figure 2
GMR activates the hsp70 promoter in trans. (A) Schematics of genotypes and images of GFP expression in third-instar eye discs. Top row, GFP fluorescence resulting from cis-activation by an insertion of the Completegfp on one homolog. Bottom row, GFP fluorescence from trans-expression of GFP in flies with the Enhancerless construct on one homolog and the Promoterless construct on the other. Transgenes were placed at an RMCE target at polytene position 53F (left) or 37B (right). The posterior of the eye disc is oriented to the bottom of each image. (B) Relative quantification of GMR activation of GFP in cis and in trans by quantitative RT-PCR. Expression in cis was defined as 100% for both 53F and 37B. Error bars indicate 95% confidence intervals. *P < 0.05 (t-test).
Figure 3
Figure 3
GMR action in trans is variegated. (A) Max-projected confocal z-stacks showing GMR-driven expression of GFP in cis (top) or in trans (bottom). Constructs are identical to those in Figure 2 and are integrated at 53F. GFP is visualized by immunostaining, and ommatidial clusters are shown by Elav immunostaining. GFP expression is highest in cells R3 and R4 in both genotypes, with trans-activation showing variegated expression. Posterior is oriented to the bottom of each image. (B) Quantification of relative fluorescent intensities. Top, rough schematic of cell positions in each ommatidial cluster; intensities of GFP fluorescence were measured for each R4 cell in the posterior-most five rows and normalized to the brightest cell of the image. Percentile plots show data for expression in cis (black) and in trans (gray) at 53F (n = 427 cells from four discs for cis and 532 cells from five discs for trans) and 37B (n = 467 cells from five discs for cis and 321 cells from four discs for trans). Dashed line represents a threshold of 1% of the maximum intensity, below which expression is not detectable. Insets show density plots of the same data, demonstrating the approximately normal distribution from expression in cis and strong leftward shift from expression in trans.
Figure 4
Figure 4
Increasing enhancer–promoter distance in cis delays GFP expression, but does not lead to variegation. (A) Discs where GMR acts in trans (left) or is separated from the hsp70 promoter by 3 kb in cis (right). GFP is visualized by immunostaining, and ommatidial clusters are shown by Elav immunostaining. The distant enhancer in cis does not produce the variegated pattern of GFP fluorescence; rather, GFP expression is highest in the posterior-most cells that were the earliest to commit to the R cell fate and lowest or undetectable in the newly committing cells. (B) Quantification of relative R4 cell fluorescent intensities for GMR action in trans and action from a distance in cis. Schematic shows the positions of row 1 (posterior-most, longest committed) through row 5 that label the x-axis in the box plots below. Left, GMR action in trans (n = 984 cells from nine discs); right, GMR action in cis with 3 kb separation from the promoter (n = 458 cells from six discs). Outliers are indicated by white circles; note the presence of cells at 0% and at 100% of the maximum fluorescence in all rows for trans-action, but not for cis-action. A significant difference in relative intensities is observed between row 1 cells expressing GFP in cis vs. in trans by either parametric (t-test) or nonparametric (Mann–Whitney) statistical tests.
Figure 5
Figure 5
A promoter in cis decreases GMR action in trans. (A) Top, schematic showing the Enhancerless construct paired with CompletelacZ. This combination of paired alleles produces variegated GFP fluorescence when integrated at 53F or 37B. (B) Relative quantification of GMR activation of GFP in trans with and without a promoter in cis by quantitative RT-PCR. For both 53F and 37B, total levels of GFP transcript generated from the Enhancerless construct are decreased in discs with an intact promoter in cis to GMR (right column) relative to those without a promoter in cis (defined as 100%, left column). Error bars indicate 95% confidence intervals. *P < 0.05 (t-test).
Figure 6
Figure 6
Promoters in cis and in trans compete for enhancer activity. (A) Top, schematic showing the Enhancerless construct paired with CompletemC. GMR activates mCherry expression in cis in all R3 and R4 cells, including those expressing GFP, indicating that GMR can act in cis and in trans within the same cell. (B) Relative quantification of GMR activation of mCherry in cis via quantitative RT-PCR. Expression is reduced in the presence of a promoter in trans to 83.3% of transcript levels generated from the CompletemC construct alone. In contrast, pairing with a Completegfp construct increases mCherry transcript levels by 14.5% relative to CompletemC alone. Transcript levels from CompletemC alone are defined as 100%. Error bars indicate 95% confidence intervals. *P < 0.05 (t-test) in comparison to the CompletemC construct alone.

Comment in

References

    1. Akbari O. S., Bae E., Johnsen H., Villaluz A., Wong D., et al. , 2008. A novel promoter-tethering element regulates enhancer-driven gene expression at the bithorax complex in the Drosophila embryo. Development 135: 123–131 - PMC - PubMed
    1. Apostolou E., Thanos D., 2008. Virus infection induces NF-kappaB-dependent interchromosomal associations mediating monoallelic IFN-beta gene expression. Cell 134: 85–96 - PubMed
    1. Bacher C. P., Guggiari M., Brors B., Augui S., Clerc P., et al. , 2006. Transient colocalization of X-inactivation centres accompanies the initiation of X inactivation. Nat. Cell Biol. 8: 293–299 - PubMed
    1. Bantignies F., Cavalli G., 2011. Polycomb group proteins: repression in 3D. Trends Genet. 27: 454–464 - PubMed
    1. Bartkuhn M., Renkawitz R., 2008. Long range chromatin interactions involved in gene regulation. Biochim. Biophys. Acta 1783: 2161–2166 - PubMed

Publication types

Substances

LinkOut - more resources