. 2012 May 30;32(22):7477-92.
doi: 10.1523/JNEUROSCI.0758-12.2012.

Fgf-dependent glial cell bridges facilitate spinal cord regeneration in zebrafish

Affiliations

Fgf-dependent glial cell bridges facilitate spinal cord regeneration in zebrafish

Yona Goldshmit et al. J Neurosci. .

Abstract

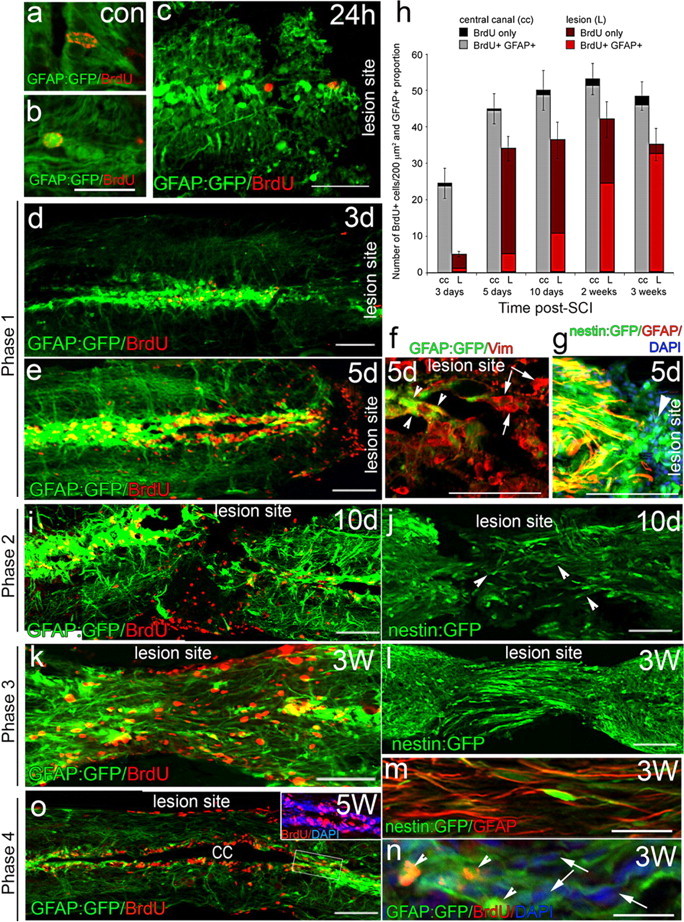
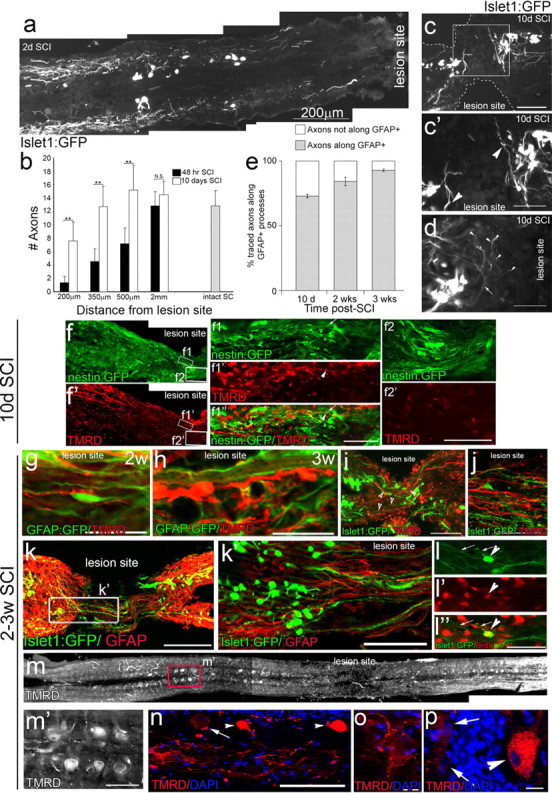
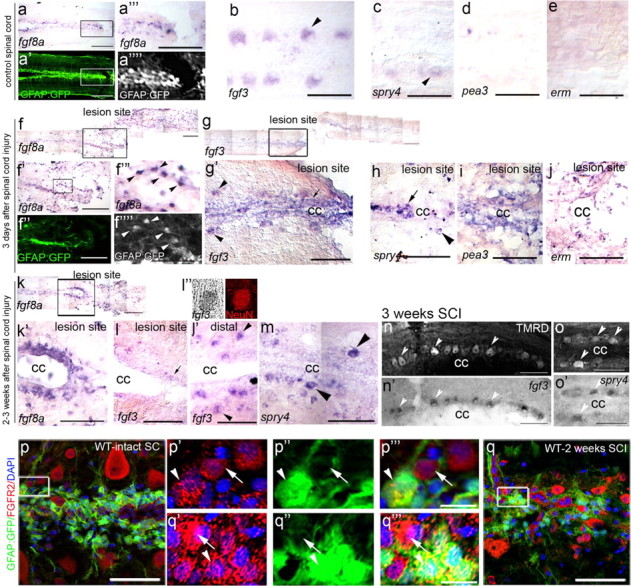
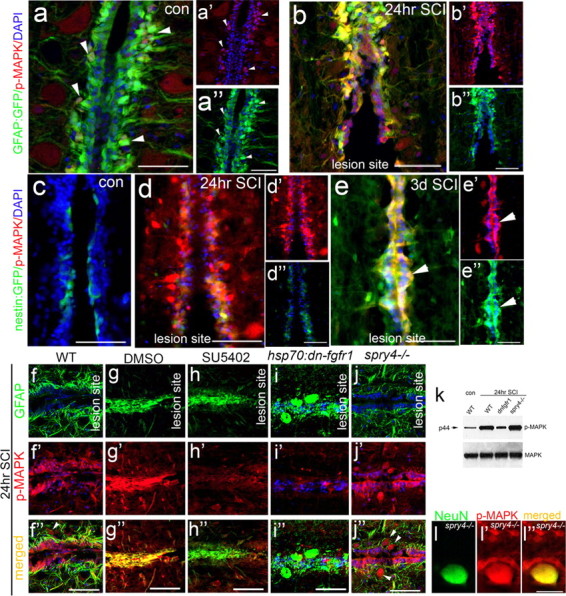
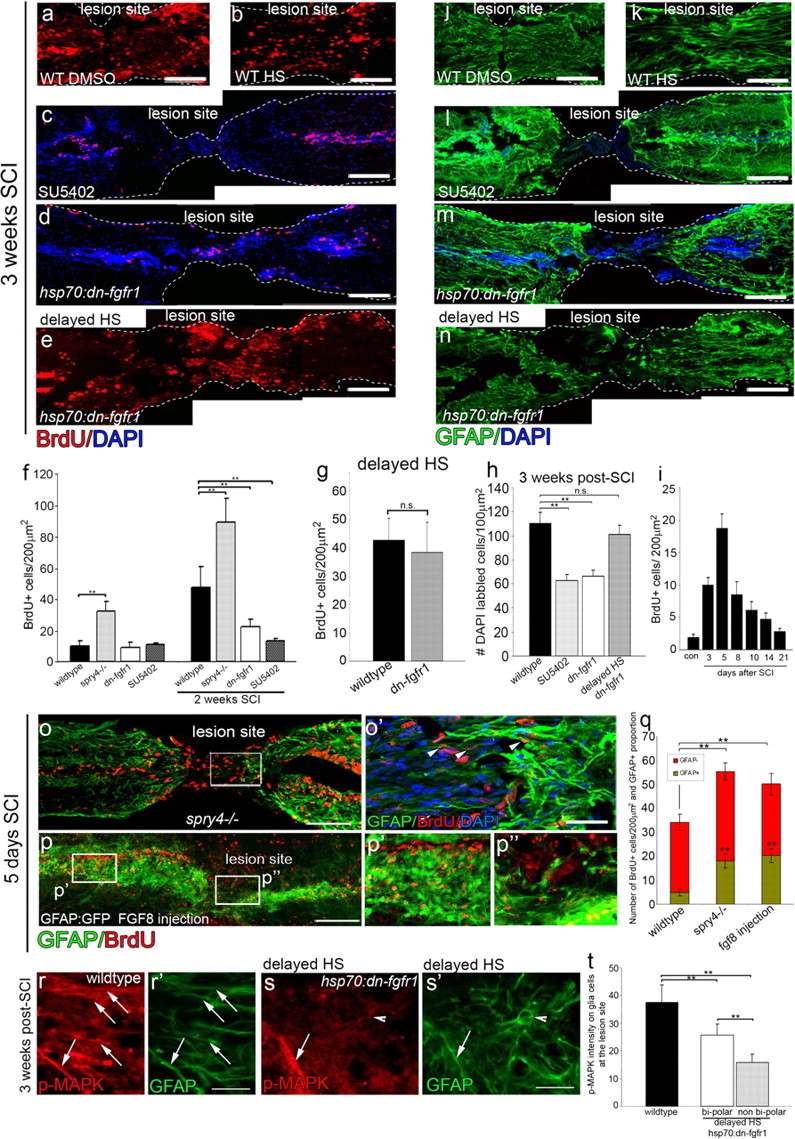
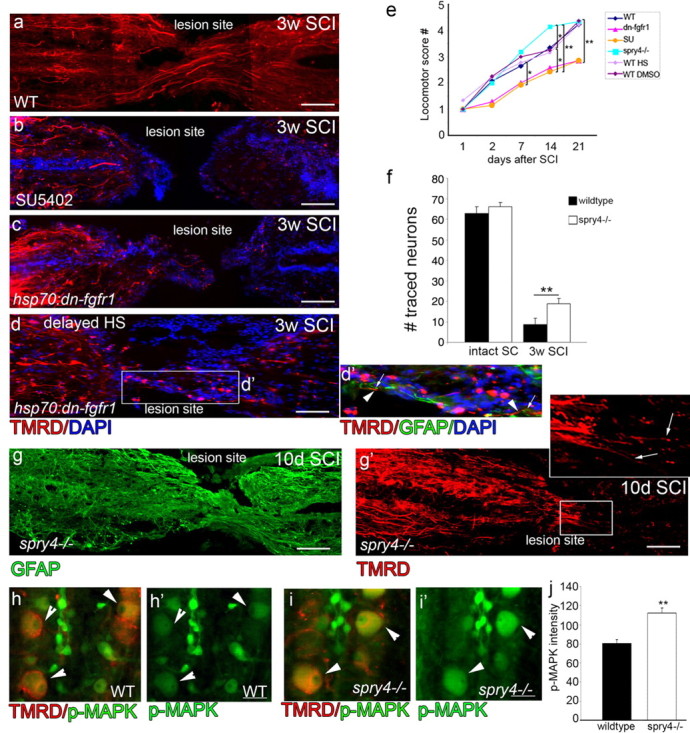
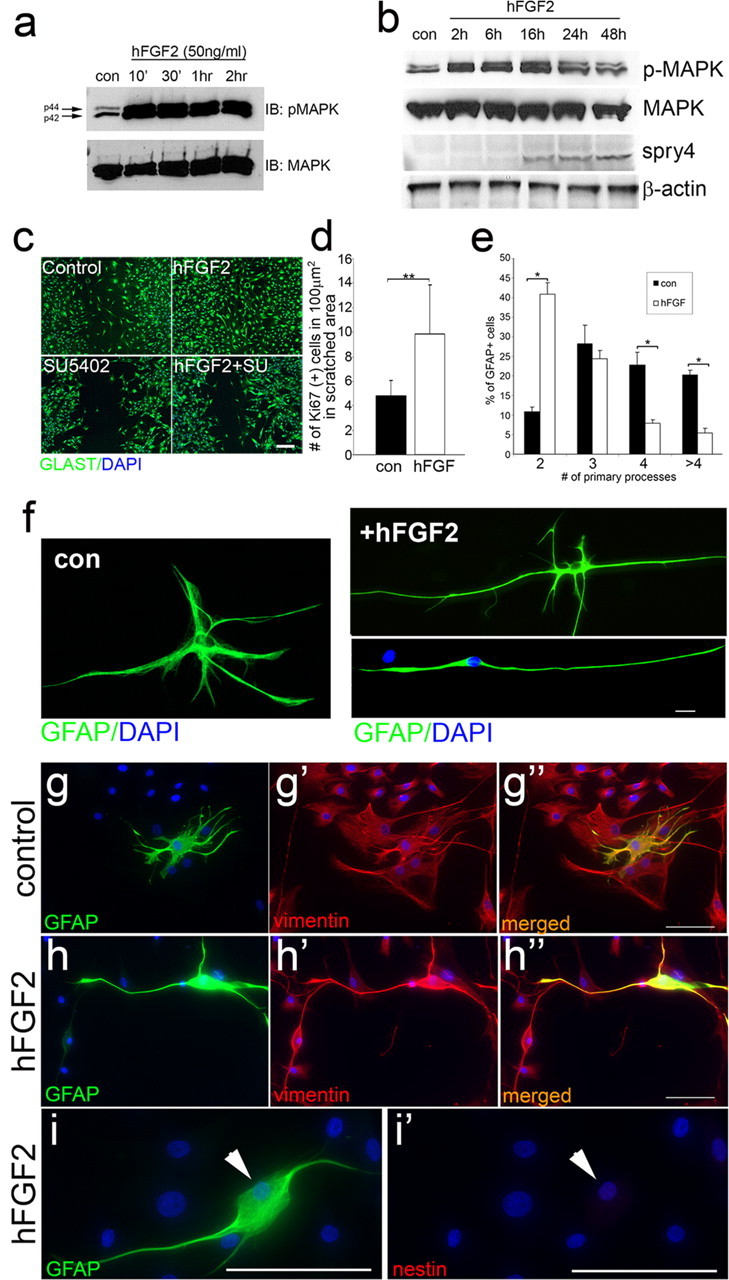
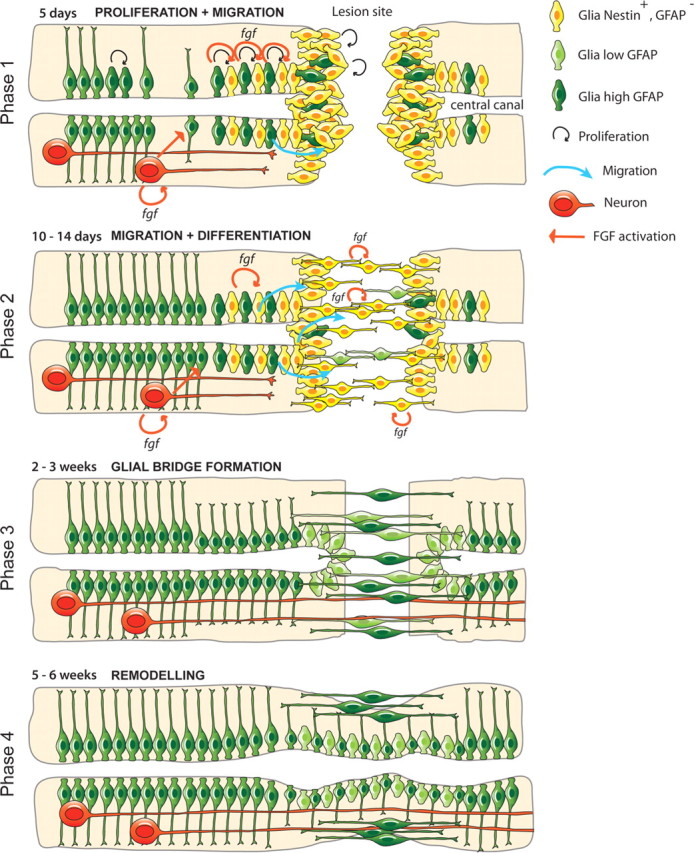
Adult zebrafish show a remarkable capacity to regenerate their spinal column after injury, an ability that stands in stark contrast to the limited repair that occurs within the mammalian CNS post-injury. The reasons for this interspecies difference in regenerative capacity remain unclear. Here we demonstrate a novel role for Fgf signaling during glial cell morphogenesis in promoting axonal regeneration after spinal cord injury. Zebrafish glia are induced by Fgf signaling, to form an elongated bipolar morphology that forms a bridge between the two sides of the resected spinal cord, over which regenerating axons actively migrate. Loss of Fgf function inhibits formation of this "glial bridge" and prevents axon regeneration. Despite the poor potential for mammalian axonal regeneration, primate astrocytes activated by Fgf signaling adopt a similar morphology to that induced in zebrafish glia. This suggests that differential Fgf regulation, rather than intrinsic cell differences, underlie the distinct responses of mammalian and zebrafish glia to injury.


Figures

Figure 1.
Figure 1.
Radial glia cells along the central canal proliferate after injury and migrate to lesion site. a–e, BrdU is incorporated in a small number of radial glia (GFAP expressing) along the central canal in intact spinal cord (a, b) and 24 h (24 h) after SCI (c). Phase 1: Proliferation increases and BrdU-labeled cells migrate to the lesion site at 3 d (d) and 5 d (e) post-SCI. f, g, The cells that accumulate at the lesion site 5 d after SCI colabel with vimentin and nestin (g, arrowhead). Some of these cells still express GFAP (f, arrowheads), whereas others have lost GFAP expression (f, arrows). h, Quantitation of BrdU-expressing cells either along the central canal (cc) or at the lesion site (L) shows proliferation (increase in BrdU cells) primarily in the first 5 d post-SCI. The vast majority of proliferating cells in the central canal are glia (GFAP positive). Cells accumulating at the lesion site slowly reexpress GFAP as they differentiate into mature glia and by 3 weeks post-SCI the vast majority of cells at the lesion are GFAP positive again. Results are expressed as the mean ± SEM. for each group (at least n = 5). i, j, Phase 2: Glia at the lesion site that express nestin and start expressing GFAP at 10 d post-SCI have short bipolar processes aligned along the anterior–posterior axis (arrowheads). k–n, Phase 3: By 3 weeks post-SCI, the glia that fill the lesion site express GFAP (k, m, n) and still express nestin (l, m). Higher-power view shows that nestin and GFAP colocalize in the same cells (m) and that these cells now have a long bipolar morphology with their processes spanning the lesion site. n, Bipolar glia arise both from proliferative cells (BrdU labeled—arrowhead) and some from nonproliferative (BrdU negative—arrows) cells. o, Phase 4: By 5 weeks post-SCI, the lesion site is remodeled and the central canal reconnected. The lesion site is only distinguishable from neighboring regions by the BrdU-labeled cells. Caudal side of the spinal cord is to the left in all panels. At least n = 10 animals from each line for each time point. Scale bars: b, n, 25 μm; c, f, g, 50 μm; d, e, i, k, o, 100 μm.
Figure 2.
Figure 2.
Axonal retraction and regeneration after SCI. a, After spinal cord lesion, injured axons initially retract as evident at 2 d post-SCI. b, Quantitation of the number of neuronal process at different distances from the lesion site reveals a significant increases in regeneration and sprouting toward the lesion site at 10 d (white bars) compared with 2 d (black bars) post-SCI at all distances analyzed (n = 7 per group, **p < 0.001, n.s., not significant). c, d, Examples of regenerating axons at 10 d post-SCI from neurons at the lesion edge. At this time, when glial bridges have not yet formed, new neurites present at the lesion are not yet aligned in the anterior–posterior axis, but instead growing perpendicular (arrowheads, c′, d). New small-bodied neurons near the lesion edge show extensive sprouting with multiple branches (arrowheads, d) arising from individual neurites (arrow). f, In nestin:GFP fish, low and high-power images of traced regenerated neurons, showing that regenerating axons at 10 d post-SCI have not yet entered the lesion site (f2). At the lesion, traced axons (arrowhead, f1) do occasionally align with glial processes (nestin positive—arrow, f1) (n = 5), whenever present. e, Quantitation shows that at all times post-SCI the majority of axons regenerate along glia processes. g–k, By 2 or 3 weeks post-SCI, the majority of TMRD-labeled neurites extend across the lesion site along GFAP-positive glial processes (2 weeks, n = 7; 3 weeks, n = 10) (g, h). New islet1:GFP-labeled neurons also regenerate along GFAP-positive glia processes (k, k′). Processes of islet1:GFP-labeled neurons, however, do not colabel with the tracer, suggesting that although they have grown across the lesion, they have not reached far enough downstream to contact the tracer injection site (n = 11) (i, j). l–l″, A proportion of new neurons with regenerating processes (arrows) at the lesion site incorporate BrdU (arrowhead). Retrograde label accumulates both in mature neuron cell bodies upstream of the lesion site (m, m′, n, p, arrowheads) and also in labeled processes terminating around unlabeled neuronal cell bodies (n, arrow; o). Scale bars: a, 200 μm; c, i, 100 μm; c′, d, f1–f1′, f2–f2′, i′, j–l′, m′, 50 μm; g, h, 25 μm; n–p, 10 μm.
Figure 3.
Figure 3.
Fgf ligands and their downstream target genes are induced in glia and neurons after SCI. a–o, Sections from Tg(GFAP:GFP) transgenic fish documenting the location of GFAP-positive glia or traced neurons on each section before and after in situ hybridization. a–e, Intact control spinal cords. fgf8a is expressed at low levels on GFAP-positive glia cells in the ventricular zone (a‴ and a⁗ show boxed region in a, a′) and fgf3 is expressed at low levels on large neurons (b, arrowhead). spry4 is expressed at low levels in neurons (c, arrowhead), whereas pea3 (d) and erm (e) are almost undetectable in adjacent sections. f–j, Three days after SCI. fgf8a expression is significantly increased on GFAP-positive glia cells found at the lesion site (f′ is a higher magnification of boxed area in f and f‴ and f⁗ are higher magnifications of boxed region in f′). fgf3 expression increases in both neurons (g; g′, boxed area in g, arrowhead) and in glia (arrow) at the cc surrounding the lesion site. spry4 expression is high in neurons (h, arrowheads) and glia (arrows), while pea3 (i) and erm (j) expression is upregulated on glia cells. (k–o, 2–3 weeks after SCI. fgf8a is highly expressed (k; k′, boxed area in k) in glia cells at the lesion site and around the cc. fgf3 expression is decreased in glia cells at the lesion site (l, arrow), but increased in neurons upstream of the lesion (l, arrowhead). (l″) fgf3-expressing cells are identified as neurons by colabeling with NeuN and by accumulation of TMRD axonal tracer labeling (n, arrowheads). spry4 expression is increased in neurons (m, arrowheads), which are also labeled by TMRD tracer (o, arrowheads). p, q, FgfR2 is upregulated on GFAP-positive glia cells (arrowheads) and neurons (arrows) 2 weeks post-SCI in injured (p; p′–p‴, boxed area in p) compared with intact (q; q′–q‴, boxed area in q) spinal cords. Caudal side of spinal cord to the left in all panels. cc, Central canal. Representative results from at least n = 4 fish in each condition. Scale bars: a, a′, f, f′, f″, g, k, 100 μm; in high-power magnification panels, including a‴, b–e, f‴, g′–j, k′–o′, p, q, 50 μm; p′–p‴, q′-q‴, 10 μm.
Figure 4.
Figure 4.
Fgf-dependent MAPK signaling is induced in glia and neurons after spinal cord injury. a, b, In intact control spinal cords p-MAPK levels are low in GFAP-expressing glia along the central canal (cc) (a–a″, arrowheads), but become strongly upregulated 24 h post-SCI (b) (n = 5). c–e, Nestin levels at the cc are also low (n = 4) in intact spinal cord, but both p-MAPK and nestin levels increase shortly after SCI (24 h, d; 3 d, e, arrowheads) in glia cells at the cc (n = 5). f–l, MAPK is activated by Fgf signaling after SCI as confirmed by Western blot analysis of protein derived from spinal cord lesion sites in wild-type, spry4−/− and dn-fgfr1 lines after SCI (k). In WT (f) and DMSO only control (g), p-MAPK levels increase 24 h post-SCI (f′, g′, k). When Fgf is inhibited by SU5402 injection (h) or heat shock of hsp70l:dn-fgfr1-EGFP fish (i), this increase in p-MAPK is abolished (h′, i′, k). Conversely, in spry4−/− fish p-MAPK activity is increased in GFAP-positive cells as in wild-type, and additionally in neurons (j″, arrowheads) that colabel with the neural NeuN marker (l–l″). Scale bars: a–j, 50 μm; l, 10 μm.
Figure 5.
Figure 5.
Fgf signaling regulates glia cell proliferation and migration. a–e, At 3 weeks post-SCI, Fgf inhibition by SU5402 injection (n = 6) (c) or heat shock of hsp70l:dn-fgfr1-EGFP (n = 7) (d) causes a significant reduction (f) in proliferation (assayed by BrdU incorporation) compared with WT DMSO (a) or wt heat shock (b) fish. In contrast, the delayed heat shock of hsp70l:dn-fgfr1-EGFP (initiated only at 6 d post-SCI) does not show a reduction in proliferation (e, g). h–n, Similarly, the resulting migration and accumulation of cells (DAPI labeled) at the lesion site is also reduced in SU5402-injected or heat-shocked hsp70l:dn-fgfr1-EGFP (h) fish compared with WT DMSO (n = 6) (j) or heat-shocked fish (n = 6) (k). Again delaying the heat shock by 5 d completely ameliorates the effect and there is no significant change in the number of cells that migrate and accumulate at the lesion in this treatment (n = 6) (h, n). i, Assessing the degree of proliferation across different time periods reveals that the bulk of the proliferative response occurs within the first 5 d post-SCI (n = 3 per time point). o–q, In contrast, Fgf signaling upregulation in spry4−/− mutants (o, n = 7) or Fgf8-injected fish (p, n = 6) results in a significant increase in proliferation already by 5 d post-SCI (q). Additionally, glia show an accelerated differentiation and earlier expression of GFAP:GFP in both of these increased Fgf signaling conditions (o–q). r–t, Differentiation of the bipolar glial morphology is correlated with MAPK signaling activity in wild-type and hsp70:dn-fgfr1 fish with delayed heat shock starting 6 d after SCI. Scale bars: a–e, j–n–p, 100 μm; o′, r, s′, 50 μm. Results are presented in f–i, q, and t as mean ± SEM, **p < 0.001, n.s., not significant.
Figure 6.
Figure 6.
Axonal regeneration depends on Fgf-induced glial bridge formation. a–d, TMRD traced regenerated axons in different conditions. In WT, axons regenerate across the lesion site and take up the TMRD tracer (n > 15) (a). In contrast, in fish with Fgf signaling inhibition either by SU5402 injections (n = 6) or by heat shock of hsp70l:dn-fgfr1-EGFP fish (n = 10), no TMRD-labeled axons cross the lesion site. (d, d′) in delayed heat shock some TMRD-labeled axons (d′, arrowheads) are crossing along elongated glia (d′, arrows). e, Locomotor recovery assays (n > 10 animals from each genotype or treatment group; *p < 0.05, **p < 0.001) is significantly reduced in hsp70l:dn-fgfr1-EGFP and SU5402 compared with different wild-type controls and spry4−/−, which shows improved motor function 3 weeks after SCI. g, g′, At 10 d post-SCI, glia at the lesion express GFAP and exhibit bipolar morphology in spry4−/− fish(g).TMRD-labeled regenerating axons that are present at the lesion can enter the site aligned correctly in the anterior–posterior position (arrows in g′ inset) (n = 15). f, By 3 weeks post-SCI in spry4−/− fish there is a significant increase in axonogenesis with more neurons labeled by tracer injections (n = 8 from each genotype) (**p < 0.001). h–j, Compared with control (h), the increase in neural regeneration assessed by TMRD tracer injection in the spry4−/− fish (i) is matched by an increase in activated MAPK signaling in these traced neurons (h, i′, arrowheads) as quantified (j) (n = 4 from each genotype), **p < 0.001. Scale bars: a–e, g, g′, 100 μm; h, i′, 10 μm. Caudal side of the spinal cord is to the left in a–g′.
Figure 7.
Figure 7.
Fgf promotes radial glia morphology in primate astrocytes. a, b, Western blot analysis for p-MAPK activation during short term (a) or long-term (b) hFGF2 addition in primate astrocytes, shows increased levels of p-MAPK and Spry4 protein levels in these cells. β-Actin and MAPK are loading controls. c, Scratch wound assay on primate astrocytes visualized by GLAST labeling after 48 h. Addition of hFGF2 increases astrocyte migration into the wound area, whereas SU5402 and hFGF2+SU5402 treatment have little effect on astrocyte migration. d, Quantitation of the number of currently proliferating cells (mean ± SEM) shows that Fgf induces proliferation (n = 3 experiments, **p < 0.001). e–i, After 7 d in culture. e, Quantitation of the number (mean ± SEM) of primary processes extending from the cell body in control (con) and hFGF2-treated astrocytes (n = 3 experiments; *p < 0.001) shows an increased number of cells with bipolar morphology in hFGF2-treated cultures. f, Cellular morphology in control and hFGF2-treated astrocytes. High-power images of control astrocytes show normal multipolar stellate morphology compared with hFGF2-treated astrocytes, which have either two main long primary process with some short secondary extensions or just two long primary processes. g–i, All primate astrocytes in control and hFGF2 treatment express vimentin (g, h). Vimentin, but not nestin (i) is expressed in primate astrocytes after 7 d of hFGF2 treatment. Scale bars: c, g, h (low magnification), 50 μm; f, i (high magnification), 10 μm.
Figure 8.
Figure 8.
Model for zebrafish spinal cord regeneration. Phase 1: Proliferation and initial migration. At 5 d after SCI, initial transection of the spinal cord stimulates secretion of Fgf ligands in the central canal, which in turn induce glial cell dedifferentiation and proliferation to generate progenitor cells. These cells begin to migrate toward the lesion edge and cells at the lesion site possess low levels of GFAP expression and high levels of nestin expression at the lesion site. Fgf is also released by neuronal cells. Phase 2: Migration and Differentiation. By 10 d post-SCI, Nestin-positive cells increase GFAP levels and maintain Fgf expression. Migration initiates and glial cells begin to fill the lesion site and elongate into bipolar morphology, a process of differentiation that is also Fgf-dependent. Fgf expression is also upregulated in neuronal cells upstream of the lesion site. At this stage axonal regeneration toward, but not through the lesion occurs. Phase 3: Glial bridge formation. By 2–3 weeks after SCI, bipolar GFAP-expressing glia have completely bridged the gap between the two transected sides of the lesion, allowing axonal migration and regeneration. Phase 4: Remodeling. By 5 weeks, the central canal has been fully reconstructed and bipolar glia are only present at the surface. Axons now extend further across the lesion site.
Figure 9.
Figure 9.
Spry4 expression after spinal cord injury in mouse. a, RT-PCR of RNA extracted from the brain, liver, muscle and spinal cord of two uninjured mice shows spry4 expression primarily in the brain and spinal cord, with some expression detected in the liver. GAPDH was used as a PCR amplification control. b, b′, Spry4 is expressed in GFAP-expressing astrocytes in the gray matter of the intact spinal cord (arrowheads). c–c″, Four days post-SCI. Spry4 is upregulated at the lesion site on GFAP-positive reactive astrocytes. d, d′, High-power magnification of an astrocyte at the lesion site, which expresses high levels of GFAP and Spry4. Scale bars: b, d, 25 μm; c, 100 μm.

References

    1. Asher RA, Morgenstern DA, Fidler PS, Adcock KH, Oohira A, Braistead JE, Levine JM, Margolis RU, Rogers JH, Fawcett JW. Neurocan is upregulated in injured brain and in cytokine-treated astrocytes. J Neurosci. 2000;20:2427–2438. - PMC - PubMed
    1. Barnabé-Heider F, Göritz C, Sabelströom H, Takebayashi H, Pfrieger FW, Meletis K, Frisén J. Origin of new glial cells in intact and injured adult spinal cord. Cell Stem Cell. 2010;7:470–482. - PubMed
    1. Bastmeyer M, Bähr M, Stuermer CA. Fish optic nerve oligodendrocytes support axonal regeneration of fish and mammalian retinal ganglion cells. Glia. 1993;8:1–11. - PubMed
    1. Becker T, Wullimann MF, Becker CG, Bernhardt RR, Schachner M. Axonal regrowth after spinal cord transection in adult zebrafish. J Comp Neurol. 1997;377:577–595. - PubMed
    1. Bernardos RL, Raymond PA. GFAP transgenic zebrafish. Gene Expr Patterns. 2006;6:1007–1013. - PubMed

Publication types

MeSH terms

Substances

LinkOut - more resources