. 2012 May 30;32(22):7662-71.
doi: 10.1523/JNEUROSCI.6479-11.2012.

Prefrontal neurons represent winning and losing during competitive video shooting games between monkeys

Affiliations

Prefrontal neurons represent winning and losing during competitive video shooting games between monkeys

Takayuki Hosokawa et al. J Neurosci. .

Abstract

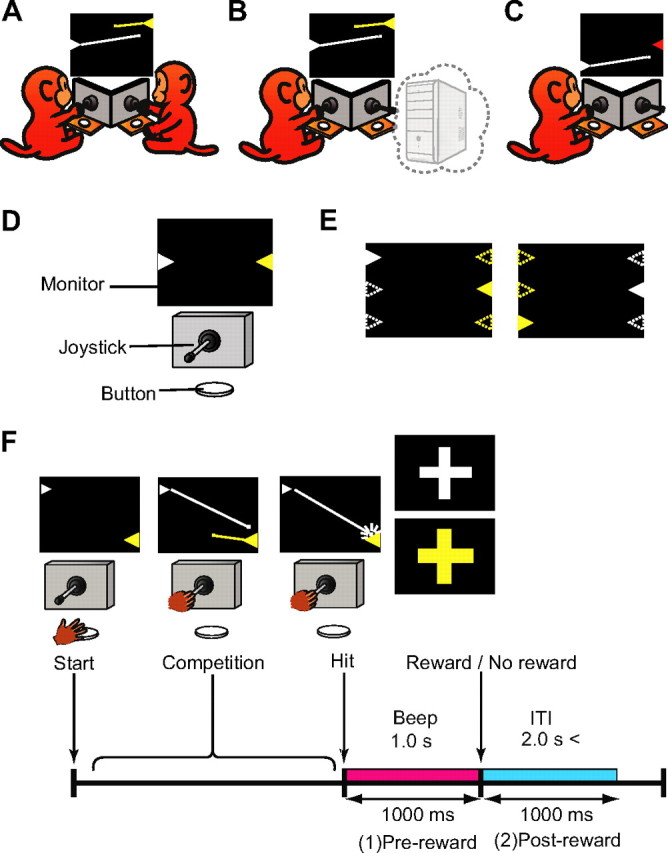
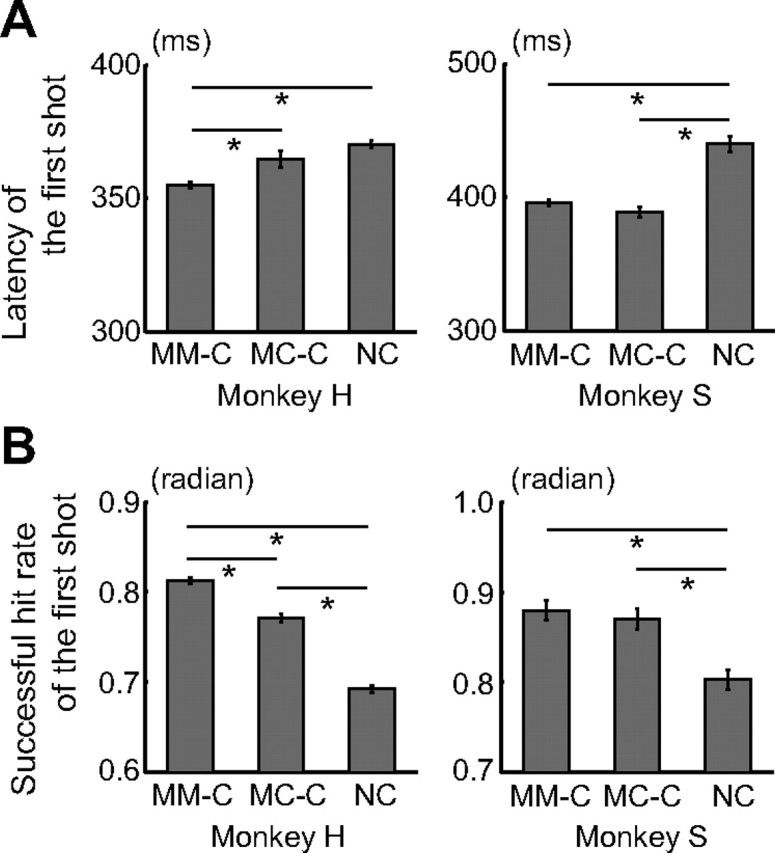
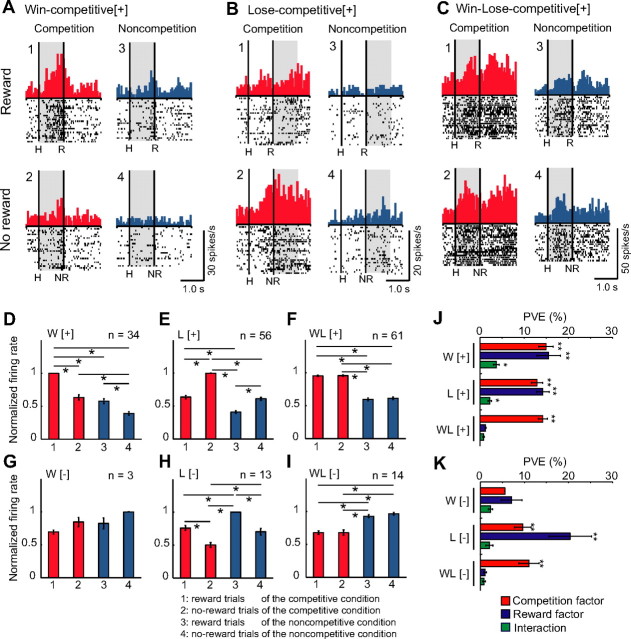
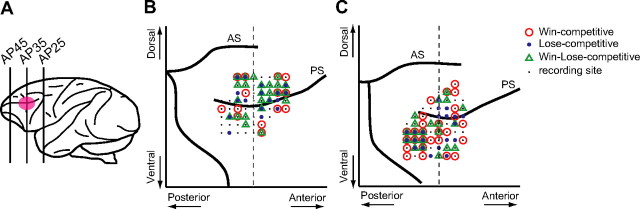
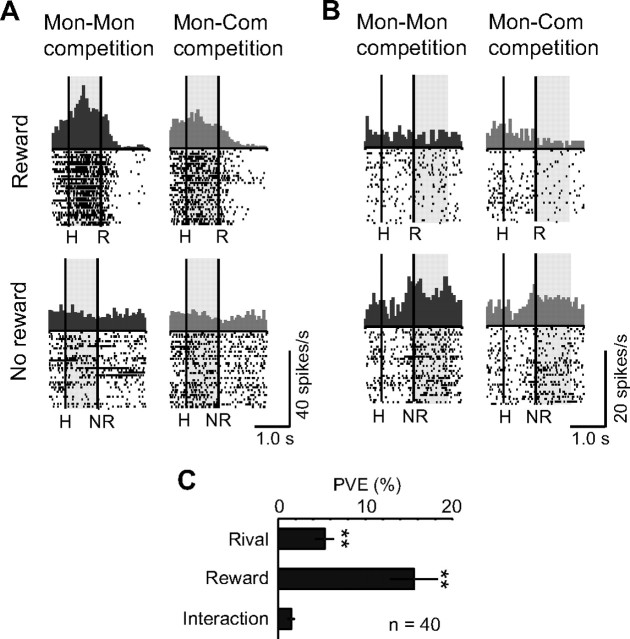
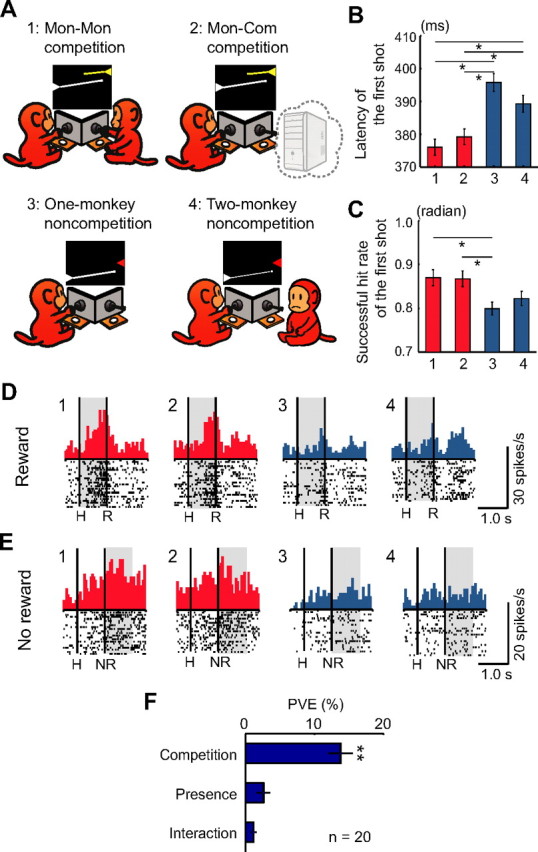
Humans and animals must work to support their survival and reproductive needs. Because resources are limited in the natural environment, competition is inevitable, and competing successfully is vitally important. However, the neuronal mechanisms of competitive behavior are poorly studied. We examined whether neurons in the lateral prefrontal cortex (LPFC) showed response sensitivity related to a competitive game. In this study, monkeys played a video shooting game, either competing with another monkey or the computer, or playing alone without a rival. Monkeys performed more quickly and more accurately in the competitive than in the noncompetitive games, indicating that they were more motivated in the competitive than in the noncompetitive games. LPFC neurons showed differential activity between the competitive and noncompetitive games showing winning- and losing-related activity. Furthermore, activities of prefrontal neurons differed depending on whether the competition was between monkeys or between the monkey and the computer. These results indicate that LPFC neurons may play an important role in monitoring the outcome of competition and enabling animals to adapt their behavior to increase their chances of obtaining a reward in a socially interactive environment.


Figures

Figure 1.
Figure 1.
Task descriptions of the competitive and noncompetitive conditions. A, Schematic diagram of the Mon–Mon competitive condition. Each monkey shot bullets from the turret (triangle) of its own color. The lines from the turrets represent the trajectories of the bullets and did not appear in the actual game. B, Schematic diagram of the Mon–Com competitive condition. Only one monkey played the game competing against the computer. The PC image in the figure indicates that the rival was not a monkey but the computer. In the actual setting, there was nothing in the position of the rival. C, Schematic diagram of the One-monkey noncompetitive condition. One monkey played a noncompetitive shooting game. In this condition, no bullets came from the other side. D, Experimental setup. There was a joystick and a button in front of each monkey. Monkeys shared one PC monitor. E, Position and spatial configuration of the turrets. The turret positions were randomly selected from top, middle, or bottom, and left or right. These positions changed from trial to trial, but they were fixed within a trial. Open triangles represent possible positions at which turrets could appear. F, Time course of the competitive shooting game and the analysis periods. ITI, Intertrial interval.
Figure 2.
Figure 2.
Behavioral data of the competitive and noncompetitive conditions. A, Latency of the first shot (mean ± SEM). Means of the median in each session were compared among the conditions. One-way ANOVA demonstrated a significant difference in latency among the three conditions (monkey H: F(2,278) = 181.2, p < 10−10; monkey S: F(2,416) = 51.4, p < 10−10). Post hoc paired comparisons were conducted using a Bonferroni's-corrected, two-tailed t test (*p < 0.05). Monkey H: n = 126 (Mon–Mon), 29 (Mon–Com), and 126 (noncompetition). Monkey S: n = 195 (Mon–Mon), 29 (Mon–Com), and 195 (noncompetition). B, Successful hit rate of the first shot (mean ± SEM). Data were normalized by the arcsine transformation before statistical analyses. One-way ANOVA demonstrated a significant difference in the successful hit rate among the three conditions (monkey H: F(2,278) = 154.5, p < 10−10; monkey S: F(2,416) = 15.5, p < 10−6). Post hoc paired comparisons were conducted using a Bonferroni's-corrected, two-tailed t test (*p < 0.05). Monkey H: n = 126 (Mon–Mon), 29 (Mon–Com), and 126 (noncompetition). Monkey S: n = 195 (Mon–Mon), 29 (Mon–Com), and 195 (noncompetition). MM-C, Mon–Mon competitive condition; MC-C, Mon–Com competitive condition; NC, noncompetitive condition.
Figure 3.
Figure 3.
LPFC neurons that showed competitive activities. AC, Raster and histogram displays for neurons that showed competitive activities: Win-competitive[+] (A), Lose-competitive[+] (B), and Win–Lose-competitive[+] (C). Displays in the left and right columns show activity in the competitive and noncompetitive conditions, respectively. The top and bottom rows show activity during reward and no-reward trials, respectively. The left vertical line in each display indicates the timing of a successful hit by either monkey. The right vertical line indicates the timing of a reward delivery (reward trials) or 1 s after a successful hit (no-reward trials). Each shaded area indicates the period when the typical activity of each type was observed. H, Successful hit; R, reward delivery; NR, 1 s after a successful hit. D–I, Mean relative magnitude of activity calculated from population data for each type of neuron (normalized mean ± SEM). D, Win-competitive[+]; E, Lose-competitive[+]; F, Win–Lose-competitive[+]; G, Win-competitive[−]; H, Lose-competitive[−]; and I, Win–Lose-competitive[−]. To obtain normalized population activity, we first obtained the mean spike rates for each neuron. We then calculated the relative magnitude of the spike rate for each type of neuron by alignment of the type of neuron in which the highest activity was observed. This analysis was conducted for the period in which the effect size was larger for each neuron. Data from different analysis periods were pooled and averaged. The mean relative magnitudes were significantly different among trial types for all types of neurons (Kruskal–Wallis H test, Win-competitive[+], H = 90.46, p < 10−19; Lose-competitive[+], H = 153.61, p < 10−33; Win–Lose-competitive[+], H = 176.18, p < 10−38; Win-competitive[−], H = 8.87, p = 0.03; Lose-competitive[−], H = 37.5, p < 10−8; Win–Lose-competitive[−], H = 38.95, p < 10−8). *p < 0.05, Bonferroni's-corrected two-tailed Mann–Whitney U test. W[+], Win-competitive[+]; L[+], Lose-competitive[+]; WL[+], Win–Lose-competitive[+]; W[−], Win-competitive[−]; L[−], Lose-competitive[−]; WL[−], Win–Lose-competitive[−]. J, K, Mean PVE. The plot shows the averaged PVE of each factor in the two-way ANCOVA (competition and reward factors and their interaction), separately for each type of neuron (mean ± SEM). We used a two-tailed Mann–Whitney U test to determine whether these PVE values were significantly greater than the chance level by comparing them with those calculated from the randomized data. *p < 0.05; **p < 10−5.
Figure 4.
Figure 4.
Recording sites of neurons that showed competitive activity. A, Recording areas. Recording areas are highlighted by a pink ellipse on a lateral view of the monkey brain. We recorded from neurons in both the upper and lower bank of the principal sulcus. Most of the recordings were made from neurons in the region between AP30 and AP40. AP, Anterior–posterior. B, C, Recording sites of neurons that showed competitive activity were mapped onto comparative locations of the right hemisphere of each monkey's brain based on magnetic resonance images (B, monkey H; C, monkey S). The circles, dots, and triangles represent locations in which neurons showed Win-competitive (Win-competitive[+] and Win-competitive[−]), Lose-competitive (Lose-competitive[+] and Lose-competitive[−]), and Win–Lose-competitive activity (Win–Lose-competitive[+] and Win–Lose-competitive[−]), respectively. There were no biases in the recorded areas for each type of neuron across four parts separated by the dorsal and ventral parts from the principal sulcus and the anterior and posterior parts from AP 35 (χ2 test; Win-activity, χ2 = 2.71, p = 0.44; Lose-activity, χ2 = 0.11, p = 0.95; Win-Lose-activity, χ2 = 4.3, p = 0.23; the data were pooled from 2 monkeys). The vertical dashed line represents AP 35. AS, Arcuate sulcus; PS, principal sulcus.
Figure 5.
Figure 5.
Effects of the rival's animacy on LPFC neuronal activity. A, B, Examples of neurons that showed greater activity in win (A) and lose (B) trials during the Mon–Mon than during the Mon–Com competition. Displays in the left and right columns show activity in the Mon–Mon and Mon–Com competitions, respectively. The top and bottom rows show activity during reward and no-reward trials, respectively. Each shaded area indicates the period when typical animacy-related activity was observed. The configuration of each raster and histogram display is the same as in Figure 3A–C. C, Mean PVE for the competitive neurons that were recorded in both the Mon–Mon and Mon–Com competition conditions. The plot shows the averaged PVE of each factor in the two-way ANCOVA (rival and reward factors and their interaction) (mean ± SEM). We used a two-tailed Mann–Whitney U test to determine whether these PVE values were significantly greater than the chance level by comparing them with those calculated from the randomized data. **p < 0.001.
Figure 6.
Figure 6.
Effects of competition and the presence of another monkey on monkey behavior and LPFC neuronal activity. A, Schematic diagrams of the Mon–Mon competitive (1), Mon–Com competitive (2), One-monkey noncompetitive (3), and Two-monkey noncompetitive (4) conditions. In the Two-monkey noncompetitive condition, there were two monkeys in the experimental booth, but only one monkey played a noncompetitive game, whereas the other monkey did not participate in the game. B, C, Latencies and successful hit rates of the first shot were compared among the four (Mon–Mon competition, Mon–Com competition, One-monkey noncompetition, and Two-monkey noncompetition) conditions. B, Latency of the first shot (mean ± SEM). One-way ANOVA demonstrated a significant difference in latency among the four conditions (F(3,92) = 12.86, p < 10−6). Post hoc paired comparisons were conducted using a Bonferroni's-corrected, two-tailed t test (*p < 0.05). n = 24 (each condition). C, Successful hit rate of the first shot (mean ± SEM). Data were normalized by the arcsine transformation before statistical analyses. One-way ANOVA demonstrated a significant difference in successful hit rate among the four conditions (F(3,92) = 4.29, p = 0.007). Post hoc paired comparisons were conducted using a Bonferroni's-corrected, two-tailed t test (*p < 0.05). n = 24 (each condition). D, E, Examples of neurons that showed greater activity in reward trials (D) and in no-reward trials (E) during the competitive compared with during the noncompetitive conditions. Neuronal activities during reward trials (D) and no-reward trials (E) under each condition are shown. Each shaded area indicates the period when typical activity in relation to competition and the presence of another monkey was observed. The configuration of each raster and histogram display is the same as in Figure 3A–C. For B–E: 1, Mon–Mon competition; 2, Mon–Com competition; 3, One-monkey noncompetition; 4, Two-monkey noncompetition. F, Mean PVE for the competitive neurons that were recorded in the four conditions. The plot shows the averaged PVE of each factor in the two-way ANCOVA (competition and presence factors and their interaction) (mean ± SEM). We used a two-tailed Mann–Whitney U test to determine whether these PVE values were significantly greater than the chance level by comparing them with those calculated from the randomized data. **p < 10−7.

References

    1. Amemori K, Sawaguchi T. Rule-dependent shifting of sensorimotor representation in the primate prefrontal cortex. Eur J Neurosci. 2006a;23:1895–1909. - PubMed
    1. Amemori K, Sawaguchi T. Contrasting effects of reward expectation on sensory and motor memories in primate prefrontal neurons. Cereb Cortex. 2006b;16:1002–1015. - PubMed
    1. Barraclough DJ, Conroy ML, Lee D. Prefrontal cortex and decision making in a mixed-strategy game. Nat Neurosci. 2004;7:404–410. - PubMed
    1. Behrens TE, Hunt LT, Woolrich MW, Rushworth MF. Associative learning of social value. Nature. 2008;456:245–249. - PMC - PubMed
    1. Blakemore SJ. The social brain in adolescence. Nat Rev Neurosci. 2008;9:267–277. - PubMed

Publication types

LinkOut - more resources