. 2012 Feb 8:3:15.
doi: 10.3389/fendo.2012.00015. eCollection 2012.

Assessment of oxidative metabolism in brown fat using PET imaging

Affiliations

Assessment of oxidative metabolism in brown fat using PET imaging

Otto Muzik et al. Front Endocrinol (Lausanne). .

Abstract

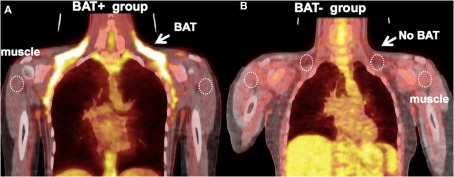
Objective: Although it has been believed that brown adipose tissue (BAT) depots disappear shortly after the perinatal period in humans, positron emission tomography (PET) imaging using the glucose analog ¹⁸F-deoxy-d-glucose (FDG) has shown unequivocally the existence of functional BAT in humans, suggesting that most humans have some functional BAT. The objective of this study was to determine, using dynamic oxygen-15 (¹⁵O) PET imaging, to what extent BAT thermogenesis is activated in adults during cold stress and to establish the relationship between BAT oxidative metabolism and FDG tracer uptake.

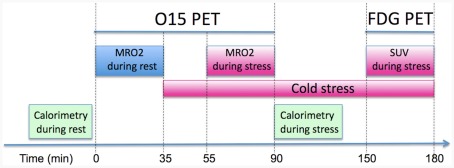
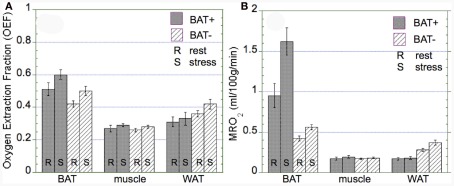
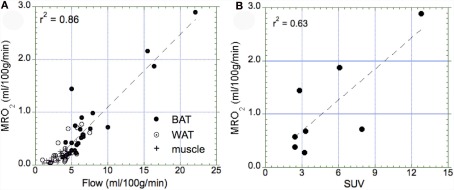
Methods: Fourteen adult normal subjects (9F/5M, 30 ± 7 years) underwent triple oxygen scans (H₂¹⁵O, C¹⁵O, ¹⁵O₂) as well as indirect calorimetric measurements at both rest and following exposure to mild cold (16°C). Subjects were divided into two groups (BAT+ and BAT-) based on the presence or absence of FDG tracer uptake (SUV > 2) in cervical-supraclavicular BAT. Blood flow and oxygen extraction fraction (OEF) was calculated from dynamic PET scans at the location of BAT, muscle, and white adipose tissue (WAT). The metabolic rate of oxygen (MRO₂) in BAT was determined and used to calculate the contribution of activated BAT to daily energy expenditure (DEE).

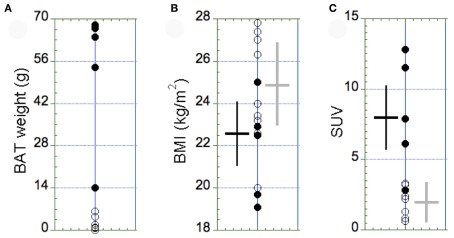
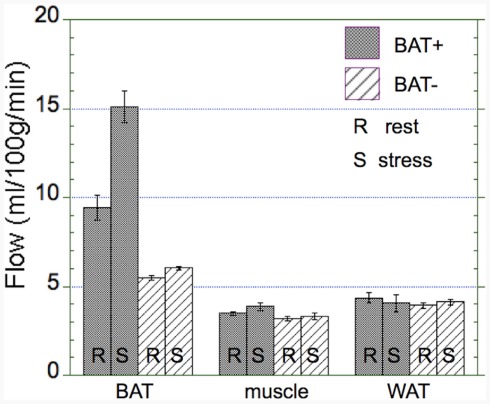
Results: The median mass of activated BAT in the BAT+ group (5F, age 31 ± 8) was 52.4 g (range 14-68 g) and was 1.7 g (range 0-6.3 g) in the BAT - group (5M/4F, age 29 ± 6). Corresponding SUV values were significantly higher in the BAT+ as compared to the BAT- group (7.4 ± 3.7 vs. 1.9 ± 0.9; p = 0.03). Blood flow values in BAT were significantly higher in the BAT+ group as compared to the BAT- group (13.1 ± 4.4 vs. 5.7 ± 1.1 ml/100 g/min, p = 0.03), but were similar in WAT (4.1 ± 1.6 vs. 4.2 ± 1.8 ml/100 g/min) and muscle (3.7 ± 0.8 vs. 3.3 ± 1.2 ml/100 g/min). Moreover, OEF in BAT was similar in the two groups (0.56 ± 0.18 in BAT+ vs. 0.46 ± 0.19 in BAT-, p = 0.39). Calculated MRO(2) values in BAT increased from 0.95 ± 0.74 to 1.62 ± 0.82 ml/100 g/min in the BAT+ group and were significantly higher than those determined in the BAT- group (0.43 ± 0.27 vs. 0.56 ± 0.24, p = 0.67). The DEE associated with BAT oxidative metabolism was highly variable in the BAT+ group, with an average of 5.5 ± 6.4 kcal/day (range 0.57-15.3 kcal/day).

Conclusion: BAT thermogenesis in humans accounts for less than 20 kcal/day during moderate cold stress, even in subjects with relatively large BAT depots. Furthermore, due to the large differences in blood flow and glucose metabolic rates in BAT between humans and rodents, the application of rodent data to humans is problematic and needs careful evaluation.

Keywords: 15O PET imaging; brown fat thermogenesis; oxidative metabolism.


Figures

Figure 1
Figure 1
Positron emission tomography protocol used to quantify the metabolic rate of oxygen (MRO2) in BAT at rest and stress (i.e., mild cold exposure at 16°C). Following the quantitative assessment of oxidative metabolism the patient underwent a FDG PET/CT scan in order to correlate MRO2 with FDG derived SUV measures.
Figure 2
Figure 2
(A) Representative image of a subject with high uptake of FDG in BAT. Five out of 14 subjects had high FDG uptake (BAT+ group, mean ± SD: SUV = 3.6 ± 0.5). ROIs were defined at the location of FDG-defined BAT, abdominal WAT (not shown), and shoulder muscle, which were then transferred to the dynamic 15O sequences for quantification. (B) Representative image of a subject from the BAT− group – there is an absence of FDG uptake at the location of BAT following exposure to cold (SUV ∼0.6).
Figure 3
Figure 3
Distribution of the amount of BAT (A), the BMI (B), and the maximal SUV in BAT (C) in the BAT+ group (full circles, N = 5) and in the BAT− group (open circles, N = 9). (A) The amount of BAT was highly variable, with most of the subjects displaying <10 g of active BAT in small supraclavicular depots. Accordingly, subjects with >10 g of active BAT were assigned to the BAT+ group. (B) The BMI was similar between the two groups (p = 0.38). (C) In contrast, the maximal SUV in BAT observed in the BAT+ group was significantly higher than in the BAT− group (p = 0.03). The error bars in (B,C) represent SD of the measurements.
Figure 4
Figure 4
Absolute changes in blood flow in the BAT+ and BAT− groups. Absolute blood flow (ml/100 g/min) in brow adipose tissue (BAT), muscle, and white adipose tissue (WAT) averaged during both rest (R) and cold exposure (S). Error bars represent the SEM. Blood flow in activated BAT is about 50% higher than in non-activated BAT and about threefold higher than in muscle and WAT (3–5 ml/100 g/min). Whereas there was a large increase in blood flow in activated BAT, virtually no increase in blood flow was determined in non-activated BAT, muscle, or WAT.
Figure 5
Figure 5
Oxygen extraction fraction (OEF) and absolute metabolic rate of oxygen (MRO2) in brown adipose tissue (BAT), muscle, and white adipose tissue (WAT) observed in the BAT+ and BAT− groups. Error bars represent the SEM. (A) The OEF was similar in both groups in BAT, muscle, and WAT, although OEF in WAT was tended to be lower in the BAT+ group. (B) In the BAT+ group, MRO2 in BAT at rest was about twice as high as that determined in the BAT− group. Moreover, following cold exposure, MRO2 increased by about 50% in the BAT+ group, but remained at the same level in the BAT− group. In contrast, MRO2 in WAT was higher in the BAT− group at both rest and cold exposure condition. Finally, MRO2 in muscle was similar for both groups at rest and following cold exposure.
Figure 6
Figure 6
Relationship between the metabolic rate of oxygen and blood flow as well as the maximal standard uptake value (SUV). (A) Correlation between the metabolic rate of oxygen in BAT (full circle), WAT (open circle), and muscle (cross) tissue. We determined a highly significant correlation (p = 0.01), indicating that tissue perfusion is the main determinant of oxidative metabolism in all three types of tissue. Highest values of oxidative metabolism was determined in activated BAT tissue (1–3 ml/100 g/min), followed by WAT tissue (0.2–0.5 ml/100 g/min), and muscle tissue (∼0.2 ml/100 g/min). (B) Correlation between maximal SUV in BAT and the metabolic rate of oxygen in those subjects who had a SUV > 2.0 (indicative of activated BAT). We found a significant correlation between glucose uptake and oxygen consumption (p = 0.02).

References

    1. Blaza S. (1983). Brown adipose tissue in man: a review. J. R. Soc. Med. 76, 213–216 - PMC - PubMed
    1. Cohade C., Osman M., Leal J., Wahl R. L. (2003). Direct comparison of (18)F-FDG PET and PET/CT in patients with colorectal carcinoma. J. Nucl. Med. 44, 1789–1796 - PubMed
    1. Cypess A. M., Lehman S., Williams G., Tal I., Rodman D., Goldfine A. B., Kuo F. C., Palmer E. L., Tseng Y. H., Doria A., Kolodny G. M., Kahn C. R. (2009). Identification and importance of brown adipose tissue in adult humans. N. Engl. J. Med. 360, 1509–151710.1056/NEJMoa0810780 - DOI - PMC - PubMed
    1. Dawkins M. J., Scopes J. W. (1965). Non-shivering thermogenesis and brown adipose tissue in the human new-born infant. Nature 206, 201–20210.1038/206201a0 - DOI - PubMed
    1. Ellis R. K. (1989). Determination of PO2 from saturation. J. Appl. Physiol. 67, 902. - PubMed

LinkOut - more resources