Review
. 2012;18(30):4648-67.
doi: 10.2174/138161212802651571.

A leap into the chemical space of protein-protein interaction inhibitors

Affiliations
Review

A leap into the chemical space of protein-protein interaction inhibitors

B O Villoutreix et al. Curr Pharm Des. 2012.

Abstract

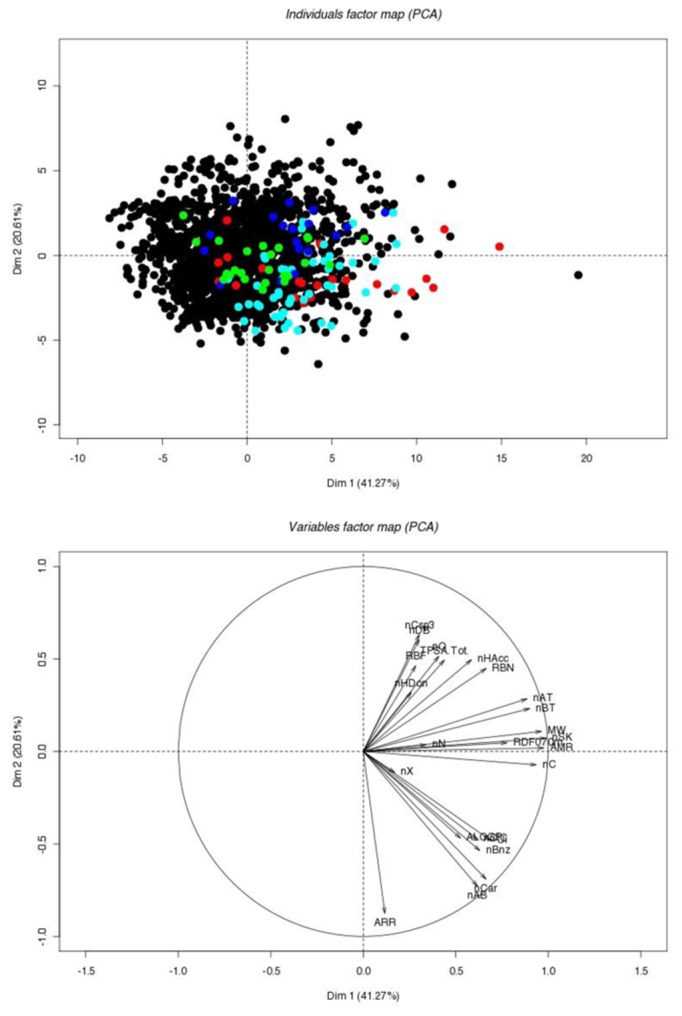
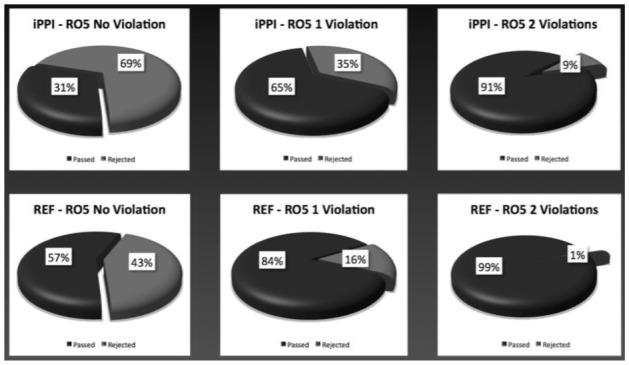
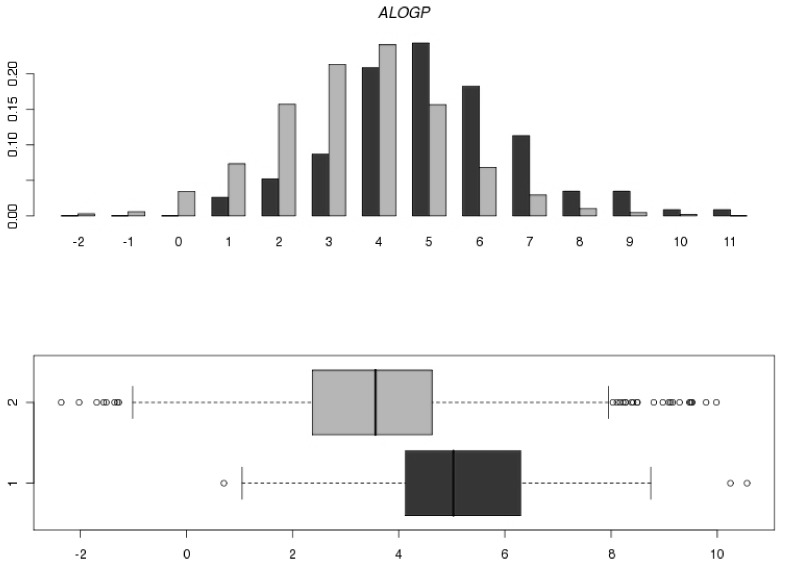
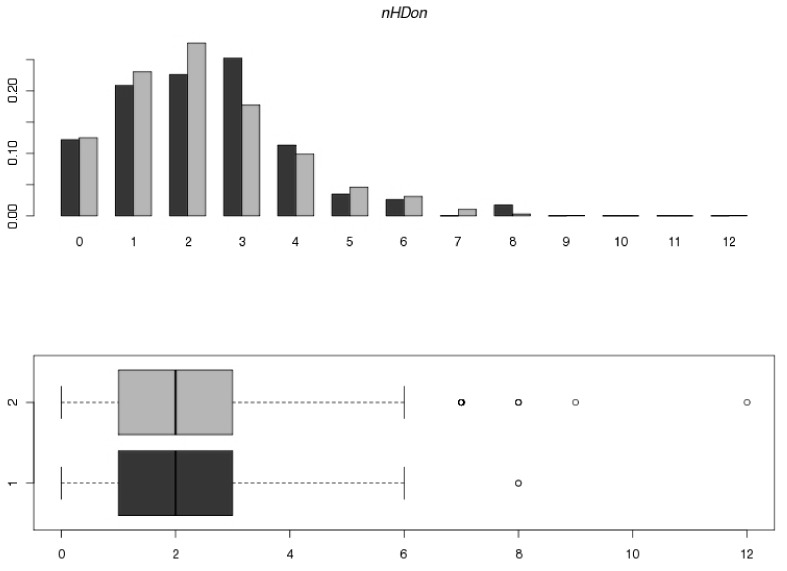
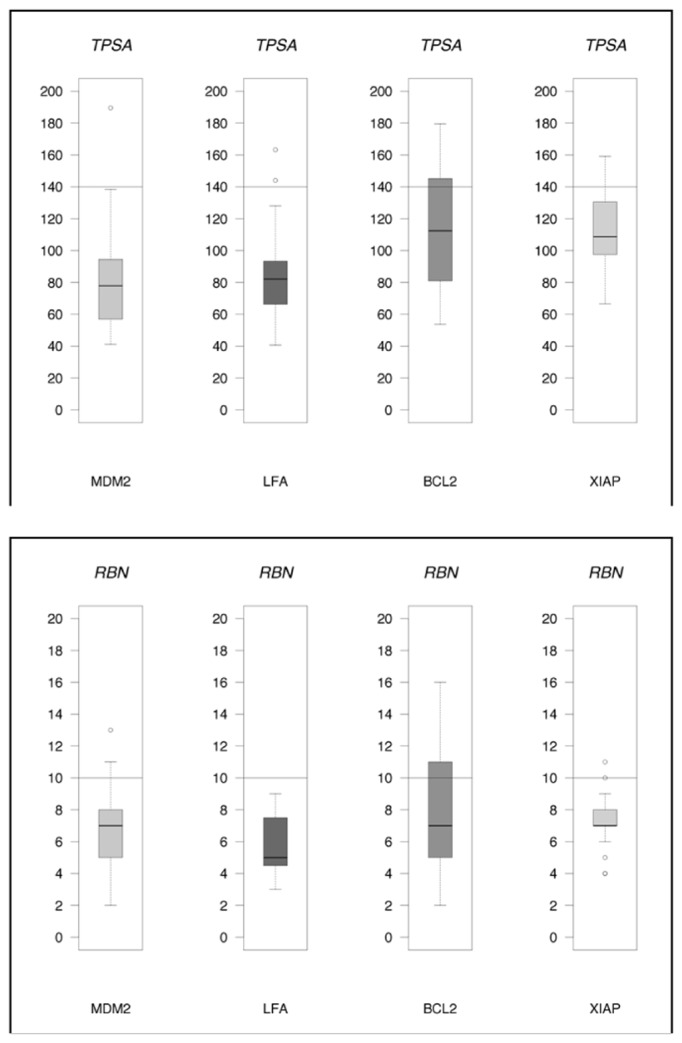
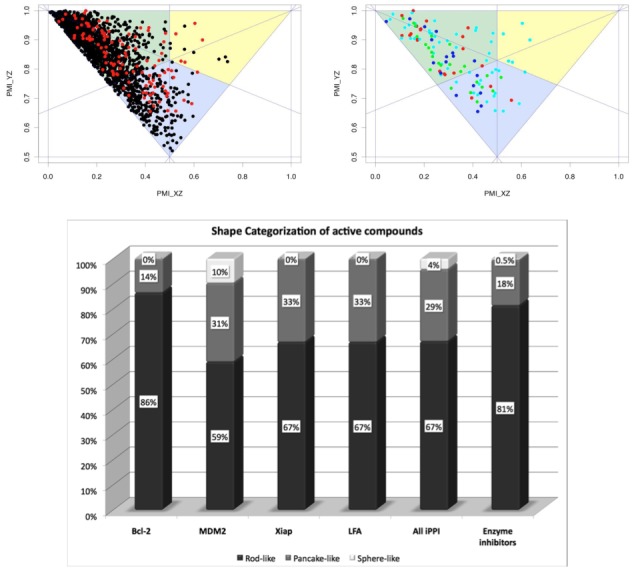
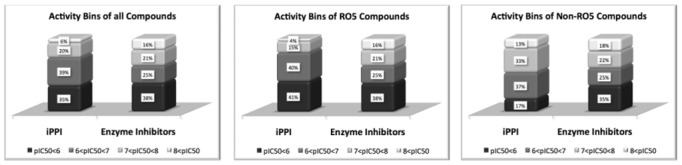
Protein-protein interactions (PPI) are involved in vital cellular processes and are therefore associated to a growing number of diseases. But working with them as therapeutic targets comes with some major hurdles that require substantial mutations from our way to design drugs on historical targets such as enzymes and G-Protein Coupled Receptor (GPCR). Among the numerous ways we could improve our methodologies to maximize the potential of developing new chemical entities on PPI targets, is the fundamental question of what type of compounds should we use to identify the first hits and among which chemical space should we navigate to optimize them to the drug candidate stage. In this review article, we cover different aspects on PPI but with the aim to gain some insights into the specific nature of the chemical space of PPI inhibitors. We describe the work of different groups to highlight such properties and discuss their respective approach. We finally discuss a case study in which we describe the properties of a set of 115 PPI inhibitors that we compare to a reference set of 1730 enzyme inhibitors. This case study highlights interesting properties such as the unfortunate price that still needs to be paid by PPI inhibitors in terms of molecular weight, hydrophobicity, and aromaticity in order to reach a critical level of activity. But it also shows that not all PPI targets are equivalent, and that some PPI targets can demonstrate a better druggability by illustrating the better drug likeness of their associated inhibitors.


Figures

Figure 1
Figure 1
Distribution of iPPI and enzyme inhibitors across their corresponding targets
Figure 2
Figure 2
Principal Component Analysis. Individual map (top panel) with enzyme inhibitor in black, Bcl-2 inhibitors in red, MDM2 inhibitors in cyan, LFA inhibitors in green, and Xiap inhibitors in blue. Variable or descriptor map (bottom panel). For both panels the two first axis of the PCA are represented covering more than 60% of the total variance.
Figure 3
Figure 3
RO5 rule versus iPPI and enzyme inhibitors
Figure 4
Figure 4
Double histograms and box plots for the RO5 and Veber descriptors. The enzyme inhibitors distributions are shown in green, and the iPPI are shown in red.
Figure 4
Figure 4
Double histograms and box plots for the RO5 and Veber descriptors. The enzyme inhibitors distributions are shown in green, and the iPPI are shown in red.
Figure 4
Figure 4
Double histograms and box plots for the RO5 and Veber descriptors. The enzyme inhibitors distributions are shown in green, and the iPPI are shown in red.
Figure 4
Figure 4
Double histograms and box plots for the RO5 and Veber descriptors. The enzyme inhibitors distributions are shown in green, and the iPPI are shown in red.
Figure 5
Figure 5
Individual vertical boxplot for iPPI on the 4 PPI targets using the RO5 and Veber descriptors. On each vertical boxplot is represented the corresponding threshold as horizontal black line, e.g 500 Da for MW in the RO5.
Figure 5
Figure 5
Individual vertical boxplot for iPPI on the 4 PPI targets using the RO5 and Veber descriptors. On each vertical boxplot is represented the corresponding threshold as horizontal black line, e.g 500 Da for MW in the RO5.
Figure 5
Figure 5
Individual vertical boxplot for iPPI on the 4 PPI targets using the RO5 and Veber descriptors. On each vertical boxplot is represented the corresponding threshold as horizontal black line, e.g 500 Da for MW in the RO5.
Figure 6
Figure 6
MW-AlogP biplot for the iPPI on the 4 PPI targets. Bcl-2 inhibitors in red, MDM2 inhibitors in cyan, LFA inhibitors in green, and Xiap inhibitors in blue.
Figure 7
Figure 7
3–75 Rule for the iPPI on the 4 PPI targets. Bcl-2 inhibitors in red, MDM2 inhibitors in cyan, LFA inhibitors in green, and Xiap inhibitors in blue.
Figure 8
Figure 8
Double histograms and boxplot for the enzyme inhibitors (green) and iPPI (red) using the bond valence and rings descriptors.
Figure 8
Figure 8
Double histograms and boxplot for the enzyme inhibitors (green) and iPPI (red) using the bond valence and rings descriptors.
Figure 9
Figure 9
Structure complexity of iPPI versus enzyme inhibitors. The figure shows the sp3 carbon ratio (top panel) and the number chiral centers (bottom panel).
Figure 10
Figure 10
Double histogram and boxplot for enzyme inhibitors (green) and iPPI (red) using the molecular shape descriptor RDF070m (top panel). Vertical boxplot (bottom panel) per PPI target showing the threshold described in a previous study (13.15).
Figure 11
Figure 11
Principal Moments of Inertia represented as a 2D plot. The triangle plots represent the global shape of the compounds sphere-like (yellow zone), pancake-like (blue-zone), and rod-like shape (green zone). Left panel shows both enzyme inhibitor (black) and iPPI (red). Right panel shows iPPI colored by PPI targets, Bcl-2 inhibitors in red, MDM2 inhibitors in cyan, LFA inhibitors in green, and Xiap inhibitors in blue.
Figure 12
Figure 12
Normalized histograms of pIC50 bins comparing potency for enzyme inhibitors and iPPI in the context of the RO5.
Figure 13
Figure 13
Ligand efficiencies (LEHA, x-axis) and lipophilic efficiencies (LLE, y-axis). Top panel shows both enzyme inhibitors (black) and iPPI (red). Bottom panel shows iPPI colored by PPI targets, Bcl-2 inhibitors in black, MDM2 inhibitors in green, LFA inhibitors in cyan, and Xiap inhibitors in red.
Figure 14
Figure 14
Levels of PAINS on the datasets. (Top panel) Proportions of compounds flagged as PAINS for each target type and for the three types of PAINS; A, B, and C. (Bottom panel) Pie chart showing the PAINS fragments among iPPI.

Similar articles

Cited by

References

    1. Venkatesan K, Rual JF, Vazquez A, Stelzl U, Lemmens I, Hirozane-Kishikawa T, Hao T, Zenkner M, Xin X, Goh KI, Yildirim MA, Simonis N, Heinzmann K, Gebreab F, Sahalie JM, Cevik S, Simon C, de Smet AS, Dann E, Smolyar A, Vinayagam A, Yu H, Szeto D, Borick H, Dricot A, Klitgord N, Murray RR, Lin C, Lalowski M, Timm J, Rau K, Boone C, Braun P, Cusick ME, Roth FP, Hill DE, Tavernier J, Wanker EE, Barabasi AL, Vidal M. An empirical framework for binary interactome mapping. Nat Methods. 2009;6:83–90. - PMC - PubMed
    1. Stumpf MPH, Thorne T, de Silva E, Stewart R, An HJ, Lappe M, Wiuf C. Estimating the size of the human interactome. Proceedings of the National Academy of Sciences. 2008;105:6959–6964. - PMC - PubMed
    1. Fuller JC, Burgoyne NJ, Jackson RM. Predicting druggable binding sites at the protein-protein interface. Drug discovery today. 2009;14:155–161. - PubMed
    1. Perkins JR, Diboun I, Dessailly BH, Lees JG, Orengo C. Transient protein-protein interactions: structural, functional, and network properties. Structure (London, England : 1993) 2010;18:1233–1243. - PubMed
    1. Nooren IMA, Thornton JM. Diversity of protein-protein interactions. The EMBO journal. 2003;22:3486–3492. - PMC - PubMed

MeSH terms