

A molecular signature in blood identifies early Parkinson's disease
- PMID: 22651796
- PMCID: PMC3424147
- DOI: 10.1186/1750-1326-7-26
A molecular signature in blood identifies early Parkinson's disease
Abstract
Background: The search for biomarkers in Parkinson's disease (PD) is crucial to identify the disease early and monitor the effectiveness of neuroprotective therapies. We aim to assess whether a gene signature could be detected in blood from early/mild PD patients that could support the diagnosis of early PD, focusing on genes found particularly altered in the substantia nigra of sporadic PD.
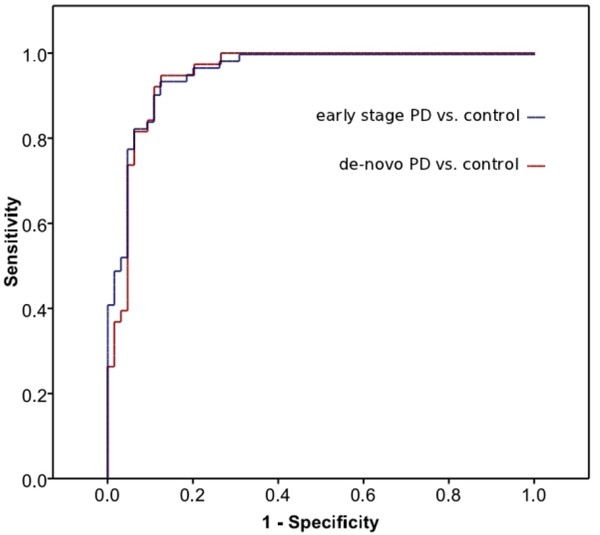
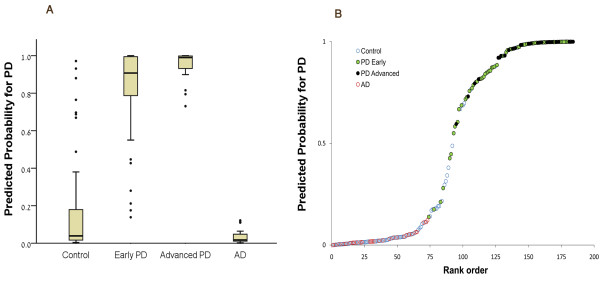
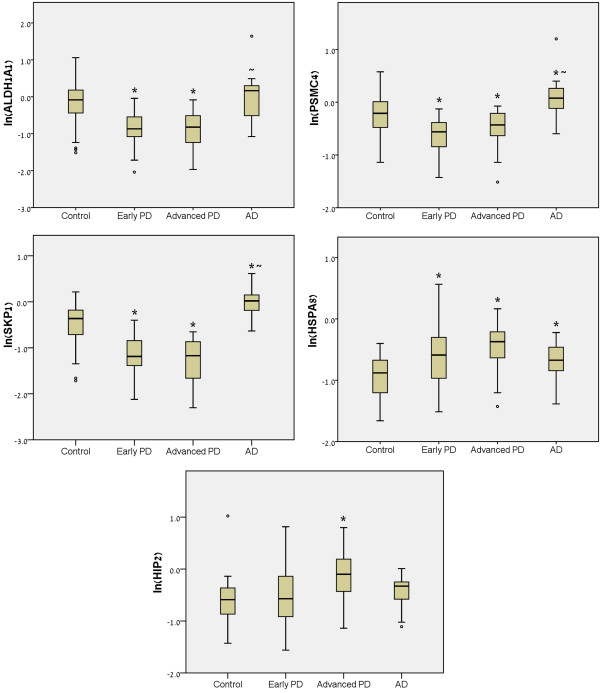
Results: The transcriptional expression of seven selected genes was examined in blood samples from 62 early stage PD patients and 64 healthy age-matched controls. Stepwise multivariate logistic regression analysis identified five genes as optimal predictors of PD: p19 S-phase kinase-associated protein 1A (odds ratio [OR] 0.73; 95% confidence interval [CI] 0.60-0.90), huntingtin interacting protein-2 (OR 1.32; CI 1.08-1.61), aldehyde dehydrogenase family 1 subfamily A1 (OR 0.86; 95% CI 0.75-0.99), 19 S proteasomal protein PSMC4 (OR 0.73; 95% CI 0.60-0.89) and heat shock 70-kDa protein 8 (OR 1.39; 95% CI 1.14-1.70). At a 0.5 cut-off the gene panel yielded a sensitivity and specificity in detecting PD of 90.3 and 89.1 respectively and the area under the receiving operating curve (ROC AUC) was 0.96. The performance of the five-gene classifier on the de novo PD individuals alone composing the early PD cohort (n = 38), resulted in a similar ROC with an AUC of 0.95, indicating the stability of the model and also, that patient medication had no significant effect on the predictive probability (PP) of the classifier for PD risk. The predictive ability of the model was validated in an independent cohort of 30 patients at advanced stage of PD, classifying correctly all cases as PD (100% sensitivity). Notably, the nominal average value of the PP for PD (0.95 (SD = 0.09)) in this cohort was higher than that of the early PD group (0.83 (SD = 0.22)), suggesting a potential for the model to assess disease severity. Lastly, the gene panel fully discriminated between PD and Alzheimer's disease (n = 29).
Conclusions: The findings provide evidence on the ability of a five-gene panel to diagnose early/mild PD, with a possible diagnostic value for detection of asymptomatic PD before overt expression of the disorder.
Figures
References
-
- UPDRS Development Committee. Unified Parkinson’s disease rating scale. In: Fahn S, Marsden CD, Goldstein M, editor. In Recent Developments in Parkinson’s Disease. Volume 2. New York: Macmillan; 1987. pp. 153–167.
-
- Rabey JM, Bass H, Bonuccelli U, Brooks D, Klotz P, Korczyn AD, Kraus P, Martinez-Martin P, Morrish P, Van Sauten W, Van Hilten B. Evaluation of the Short Parkinson’s Evaluation Scale: a new friendly scale for the evaluation of Parkinson’s disease in clinical drug trials. Clin Neuropharmacol. 1997;20:322–337. doi: 10.1097/00002826-199708000-00004. - DOI - PubMed
-
- Marinus J, Visser M, Stiggelbout AM, Rabey JM, Martinez-Martin P, Bonuccelli U, Kraus PH, van Hilten JJ. A short scale for the assessment of motor impairments and disabilities in Parkinson’s disease: the SPES/SCOPA. J Neurol Neurosurg Psychiatry. 2004;75:388–395. doi: 10.1136/jnnp.2003.017509. - DOI - PMC - PubMed
Publication types
MeSH terms
Substances
LinkOut - more resources
Full Text Sources
Other Literature Sources
Medical
Miscellaneous
