

Potential impact of adding genetic markers to clinical parameters in predicting prostate biopsy outcomes in men following an initial negative biopsy: findings from the REDUCE trial
- PMID: 22652152
- PMCID: PMC3568765
- DOI: 10.1016/j.eururo.2012.05.006
Potential impact of adding genetic markers to clinical parameters in predicting prostate biopsy outcomes in men following an initial negative biopsy: findings from the REDUCE trial
Abstract
Background: Several germline single nucleotide polymorphisms (SNPs) have been consistently associated with prostate cancer (PCa) risk.
Objective: To determine whether there is an improvement in PCa risk prediction by adding these SNPs to existing predictors of PCa.
Design, setting, and participants: Subjects included men in the placebo arm of the randomized Reduction by Dutasteride of Prostate Cancer Events (REDUCE) trial in whom germline DNA was available. All men had an initial negative prostate biopsy and underwent study-mandated biopsies at 2 yr and 4 yr. Predictive performance of baseline clinical parameters and/or a genetic score based on 33 established PCa risk-associated SNPs was evaluated.
Outcome measurements and statistical analysis: Area under the receiver operating characteristic curves (AUC) were used to compare different models with different predictors. Net reclassification improvement (NRI) and decision curve analysis (DCA) were used to assess changes in risk prediction by adding genetic markers.
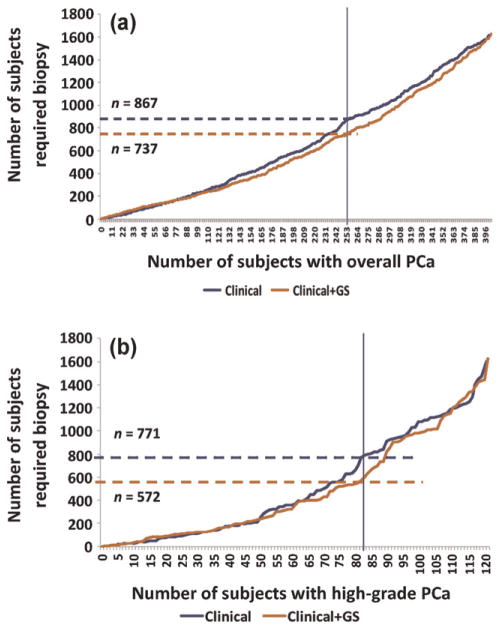
Results and limitations: Among 1654 men, genetic score was a significant predictor of positive biopsy, even after adjusting for known clinical variables and family history (p = 3.41 × 10(-8)). The AUC for the genetic score exceeded that of any other PCa predictor at 0.59. Adding the genetic score to the best clinical model improved the AUC from 0.62 to 0.66 (p<0.001), reclassified PCa risk in 33% of men (NRI: 0.10; p=0.002), resulted in higher net benefit from DCA, and decreased the number of biopsies needed to detect the same number of PCa instances. The benefit of adding the genetic score was greatest among men at intermediate risk (25th percentile to 75th percentile). Similar results were found for high-grade (Gleason score ≥ 7) PCa. A major limitation of this study was its focus on white patients only.
Conclusions: Adding genetic markers to current clinical parameters may improve PCa risk prediction. The improvement is modest but may be helpful for better determining the need for repeat prostate biopsy. The clinical impact of these results requires further study.
Copyright © 2012 European Association of Urology. Published by Elsevier B.V. All rights reserved.
Figures


Comment in
-
Will biomarkers save prostate cancer screening?Eur Urol. 2012 Dec;62(6):962-3; discussion 964-5. doi: 10.1016/j.eururo.2012.06.034. Epub 2012 Jun 27. Eur Urol. 2012. PMID: 22749734 No abstract available.
References
-
- Jemal A, Siegel R, Ward E, Hao Y, Xu J, Thun MJ. Cancer statistics, 2009. CA Cancer J Clin. 2009;59:225–9. - PubMed
-
- Presti JC., Jr Repeat prostate biopsy—when, where, and how. Urol Oncol. 2009;27:312–4. - PubMed
-
- Amundadottir LT, Sulem P, Gudmundsson J, et al. A common variant associated with prostate cancer in European and African populations. Nat Genet. 2006;38:652–8. - PubMed
-
- Gudmundsson J, Sulem P, Manolescu A, et al. Genome-wide association study identifies a second prostate cancer susceptibility variant at 8q24. Nat Genet. 2007;39:631–7. - PubMed
-
- Yeager M, Orr N, Hayes RB, et al. Genome-wide association study of prostate cancer identifies a second risk locus at 8q24. Nat Genet. 2007;39:645–9. - PubMed
Publication types
MeSH terms
Substances
Grants and funding
LinkOut - more resources
Full Text Sources
Other Literature Sources
Medical
