. 2012 Jun;8(6):893-902.
doi: 10.4161/auto.19738. Epub 2012 Jun 1.

Autophagy is active in normal colon mucosa

Affiliations

Autophagy is active in normal colon mucosa

Jean-Francois Groulx et al. Autophagy. 2012 Jun.

Abstract

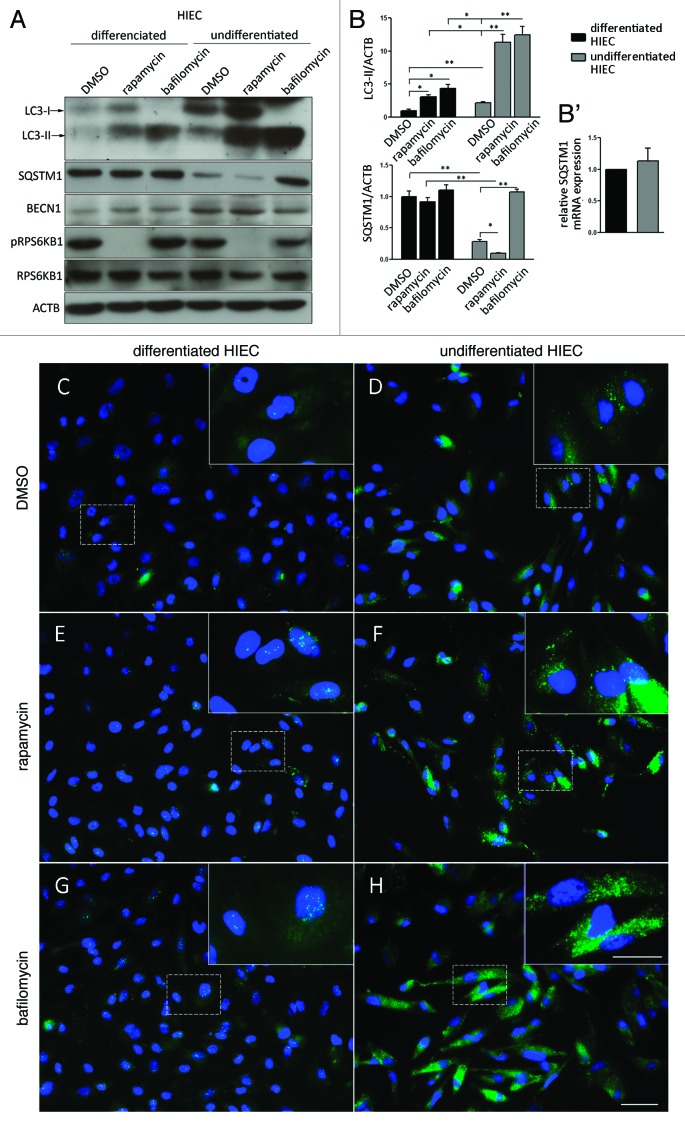
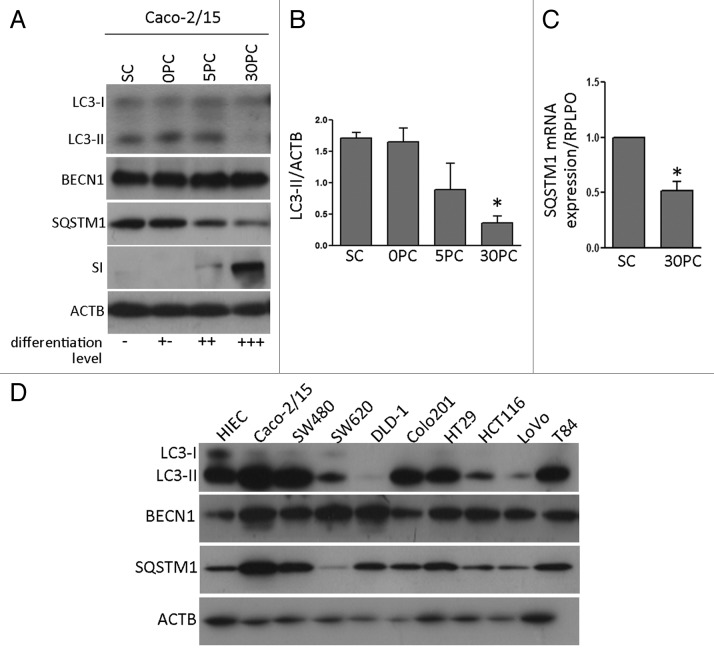
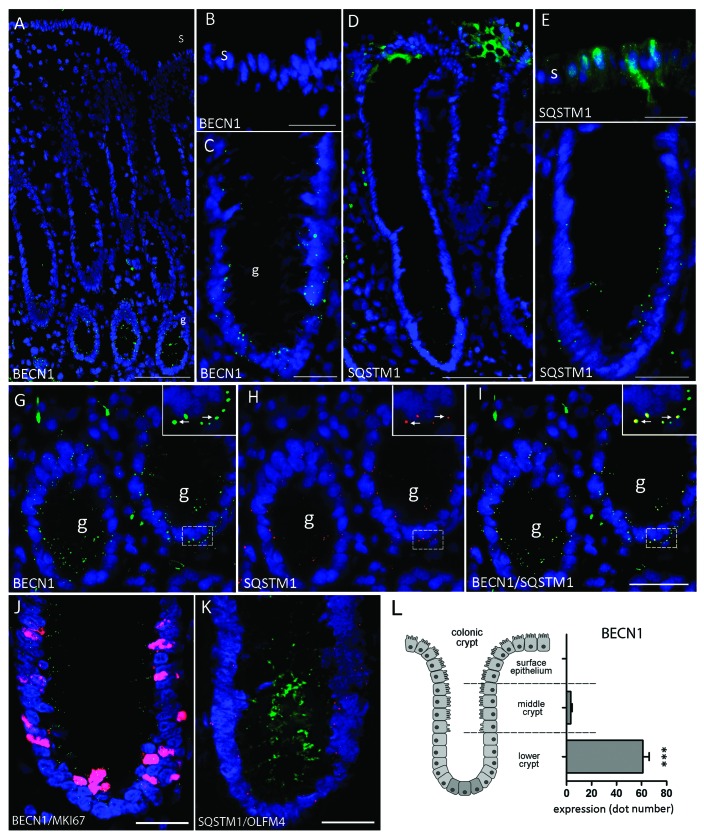
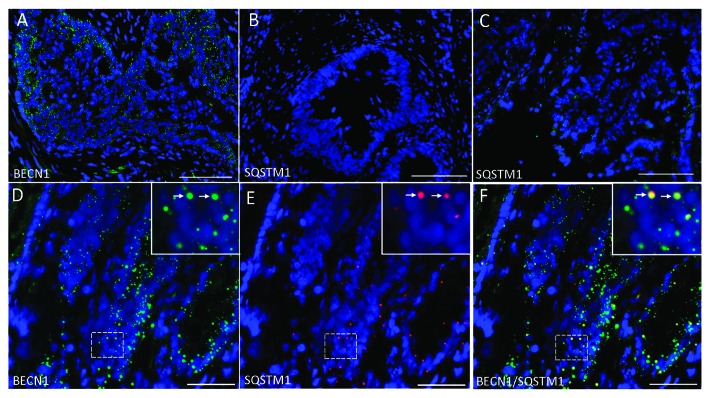
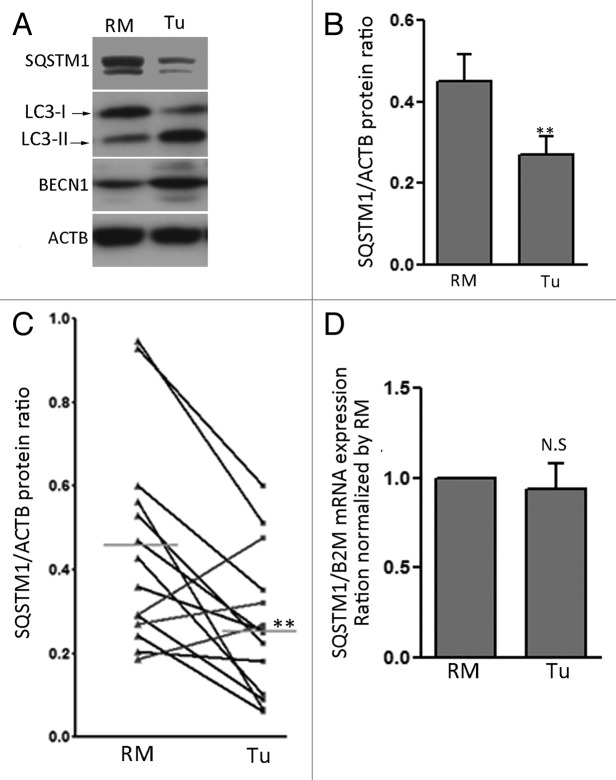
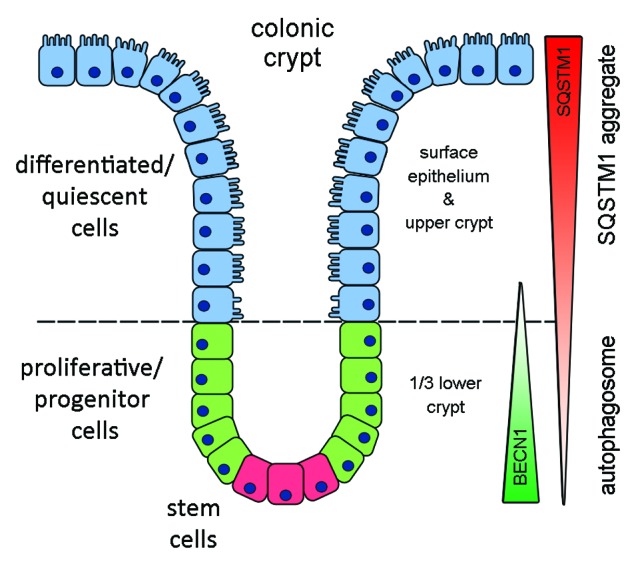
Recently, autophagy has been found to be strongly activated in colon cancer cells, but few studies have addressed the normal colon mucosa. The aim of this study was to characterize autophagy in normal human intestinal cells. We used the expression of LC3-II and BECN1 as well as SQSTM1 as markers of autophagy activity. Using the normal human intestinal epithelial crypt (HIEC) cell experimental model, we found that autophagy was much more active in undifferentiated cells than in differentiated cells. In the normal adult colonic mucosa, BECN1 was found in the proliferative epithelial cells of the lower part of the gland while SQSTM1 was predominantly found in the differentiated cells of the upper part of the gland and surface epithelium. Interestingly, the weak punctate pattern of SQSTM1 expression in the lower gland colocalized with BECN1-labeled autophagosomes. The usefulness of SQSTM1 as an active autophagy marker was confirmed in colon cancer specimens at the protein and transcript levels. In conclusion, our results show that autophagy is active in the colonic gland and is associated with the intestinal proliferative/undifferentiated and progenitor cell populations.


Figures

None
Figure 1. Downregulation of autophagy with intestinal differentiation in vitro. (A) Representative western blot analysis of LC3, BECN1, SQSTM1, phospho-RPS6KB1 and RPS6KB1 in differentiated and undifferentiated HIEC cells treated with DMSO, rapamycin and bafilomycin for 2 h. (B) Representative graph showing relative amounts of LC3 and SQSTM1 determined by optical densitometry. Data were normalized with ACTB/β-actin. Mean ± SEM, *p ≤ 0.05, **p ≤ 0.01, n = 3, paired t-test. (B') Quantitative RT-PCR of SQSTM1 mRNA in differentiated and undifferentiated HIEC cells. Mean ± SEM, n = 3, ns paired t-test. (C–H) Representative images of indirect immunofluroescence of LC3 on differentiated (C,E and G) and undifferentiated HIEC cells (D,F and H) treated with DMSO (C and D), rapamycin (E and F) and bafilomycin (G and H) for 2 h. Scale bars: 50 µm, insert: 25 µm.
None
Figure 2. Autophagy in cancer cell models. (A) western blot analysis of LC3, BECN1, SQSTM1 and SI/sucrase in Caco-2/15 cells, proliferative at subconfluence (SC) and differentiating at postconfluent stages (PC). (B) Representative graph showing relative amounts of LC3 determined by optical densitometry. Data were normalized with ACTB. Mean ± SEM, *p ≤ 0.05, n = 3, paired t-test. (C) Quantitative RT-PCR of SQSTM1 mRNA in Caco-2/15 cells at sub-confluence (SC) and post-confluence (PC). Mean ± SEM, *p ≤ 0.05, n = 3, paired t-test. (D) Representative western blot analysis of LC3-II, BECN1 and SQSTM1 in 9 colon cancer cell lines for comparison with undifferentiated HIEC cells.
None
Figure 3. Representative immunofluorescence staining for BECN1 and SQSTM1 in the normal adult colon. (A) Expression of BECN1 in the normal adult colon. (B) Surface epithelium was negative while (C) BECN1 expression showed strong staining in small puncta located in the lower part of the colonic gland (g). (D) Expression of SQSTM1 in the normal adult colon. (E) SQSTM1 was strongly detected in the upper third of the gland and in the surface (s) epithelium. (F) Weak expression was observed in the lower third of the gland (g). (G–I) Colocalization of BECN1 and SQSTM1 in the lower regions of the adult colonic gland. (G) Expression of BECN1 (green), (H) SQSTM1 (red) and (I) merged image showing the colocalization of both proteins (arrows). (J) Colocalization of BECN1 and MKI67 in the lower third of the gland. (K) Colocalization of SQSTM1 and OLFM4 in the lower third of the gland. (L) Estimation of BECN1 expression in the lower crypt, middle crypt and upper crypt/surface epithelium (n = 8; ***p < 0.001). Scale bars: (A) 100 µm; (B, C, E, F, J and K) 25 µm; (D and G–I) 50 µm.
None
Figure 4. Representative immunofluorescence staining for BECN1 and SQSTM1 in colon cancer. (A) Expression of BECN1 in colon cancer. (B) Expression of SQSTM1 in colon cancer showing no expression in some specimens or (C) weak expression in others. (D) Colocalization of BECN1 (green) and (E) SQSTM1 (red) and the (F) merged image showing colocalization of both proteins (arrows). Scale: (A–C) = 100 µm; (D–F) = 50 µm.
None
Figure 5. SQSTM1 is degraded in colon cancer specimens. (A) Representative western blot analysis for SQSTM1, LC3-II, BECN1 and ACTB in patient-matched resection margins (RM) and corresponding primary tumors (Tu). Autophagy was strongly activated in Tu compared with RM. (B) Representative graph showing relative amounts of SQSTM1 in patient-matched resection margins and corresponding primary tumors determined by optical densitometry. Data were normalized with ACTB. Mean ± SEM, **p ≤ 0.01, n = 14, paired t-test. (C) Dot graph of individual SQSTM1/ACTB ratios showed a significant decrease in 10 (black) of the 14 paired samples analyzed. (D) Quantitative RT-PCR analyses of SQSTM1 mRNA levels in patient-matched resection margins and corresponding primary tumors. Data were normalized with B2M and RM values were set at 1. n = 14, paired t-test, N.S. = not significant.
None
Figure 6. Schematic representation of BECN1 and SQSTM1 expression in normal intestinal cells. BECN1 was found predominantly expressed in the undifferentiated proliferative and progenitor/stem cells of the lower gland while SQSTM1 expression was weak in undifferentiated cells but stronger in differentiated cells where autophagy is minimal.

References

    1. Levine B, Klionsky DJ. Development by self-digestion: molecular mechanisms and biological functions of autophagy. Dev Cell. 2004;6:463–77. doi: 10.1016/S1534-5807(04)00099-1. - DOI - PubMed
    1. Klionsky DJ, Cregg JM, Dunn WA, Jr., Emr SD, Sakai Y, Sandoval IV, et al. A unified nomenclature for yeast autophagy-related genes. Dev Cell. 2003;5:539–45. doi: 10.1016/S1534-5807(03)00296-X. - DOI - PubMed
    1. Xie Z, Klionsky DJ. Autophagosome formation: core machinery and adaptations. Nat Cell Biol. 2007;9:1102–9. doi: 10.1038/ncb1007-1102. - DOI - PubMed
    1. Cao Y, Klionsky DJ. Physiological functions of Atg6/Beclin 1: a unique autophagy-related protein. Cell Res. 2007;17:839–49. doi: 10.1038/cr.2007.78. - DOI - PubMed
    1. Mehrpour M, Esclatine A, Beau I, Codogno P. Overview of macroautophagy regulation in mammalian cells. Cell Res. 2010;20:748–62. doi: 10.1038/cr.2010.82. - DOI - PubMed

Publication types

MeSH terms

LinkOut - more resources