. 2012 Jul;122(7):2637-51.
doi: 10.1172/JCI62058. Epub 2012 Jun 1.

Targeting the FOXO1/KLF6 axis regulates EGFR signaling and treatment response

Affiliations

Targeting the FOXO1/KLF6 axis regulates EGFR signaling and treatment response

Jaya Sangodkar et al. J Clin Invest. 2012 Jul.

Abstract

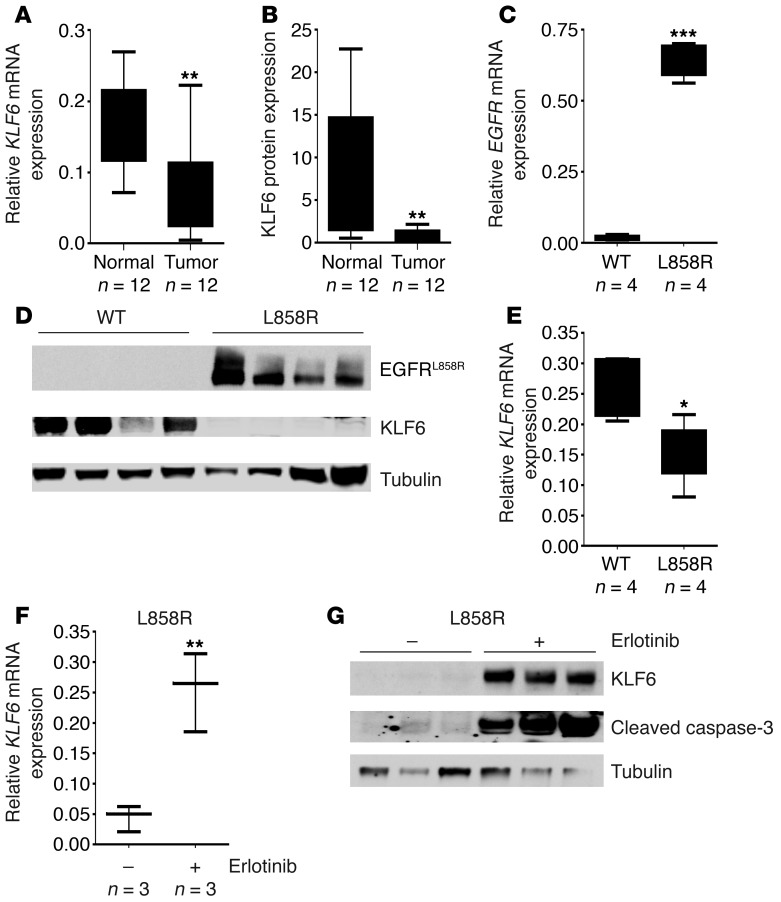
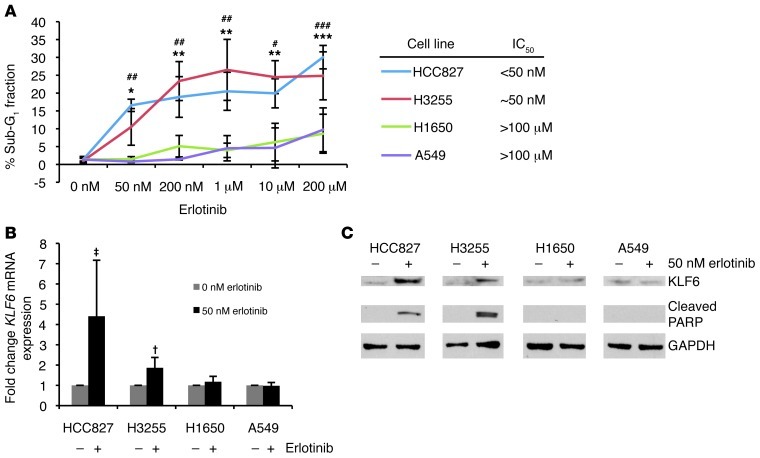
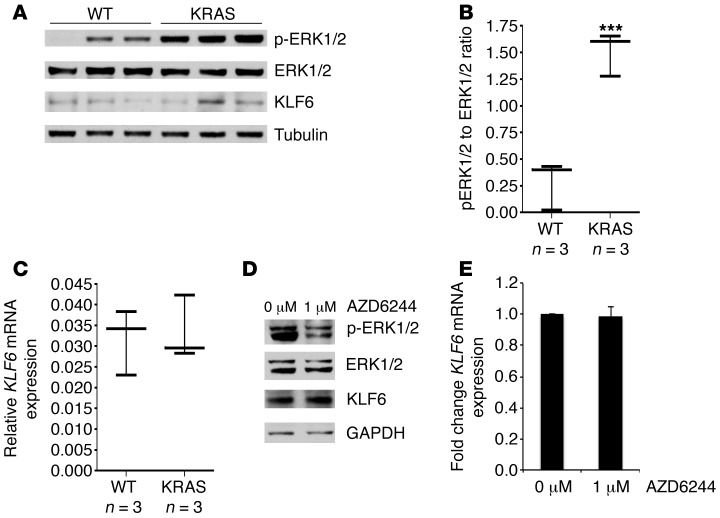
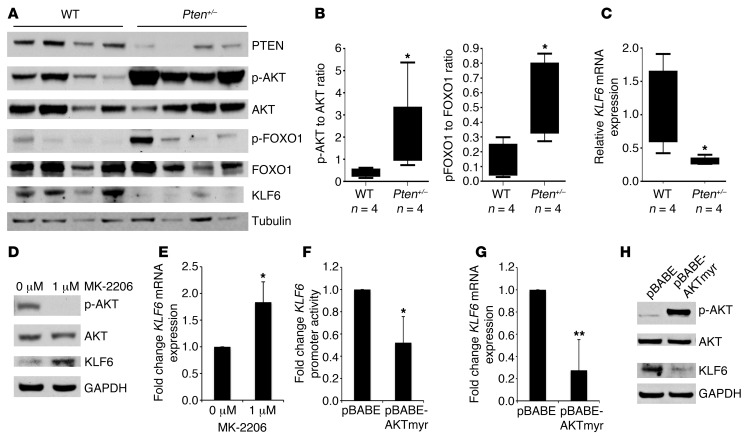
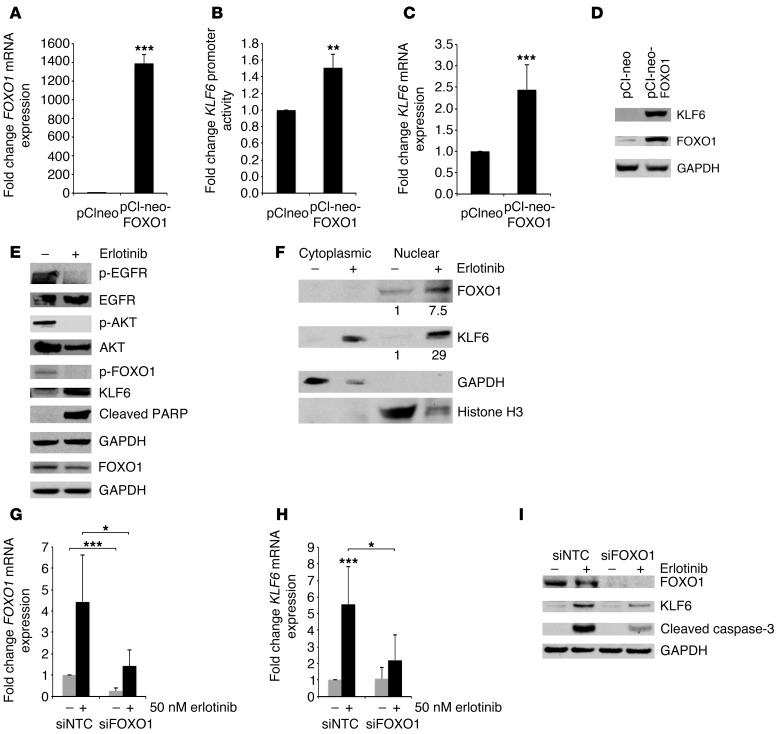
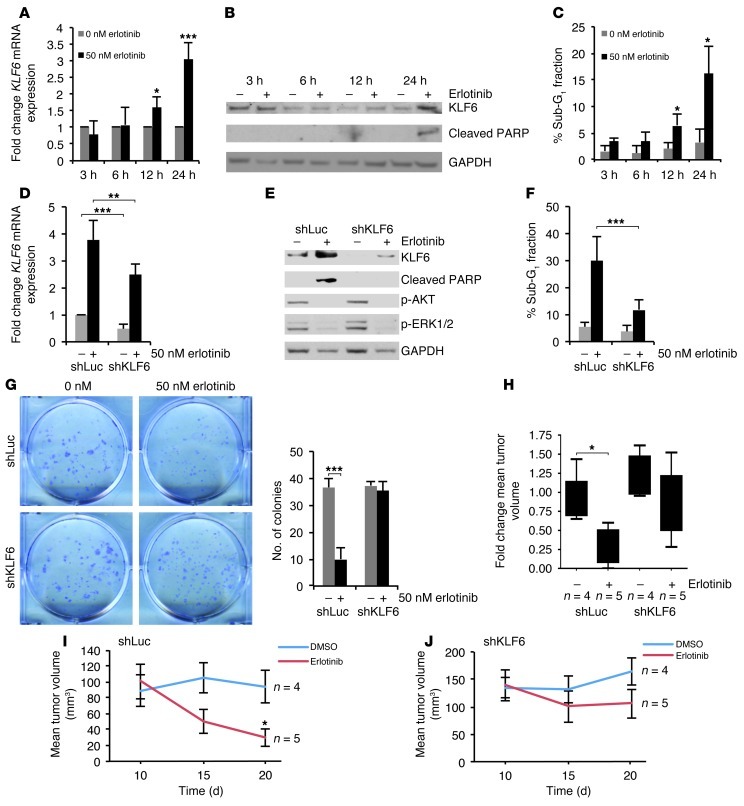
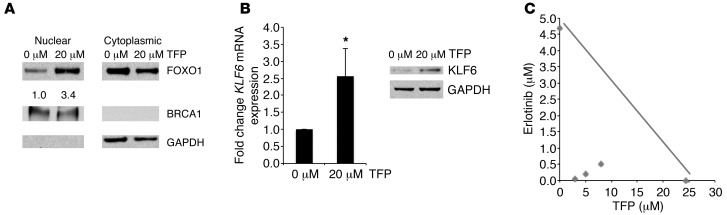
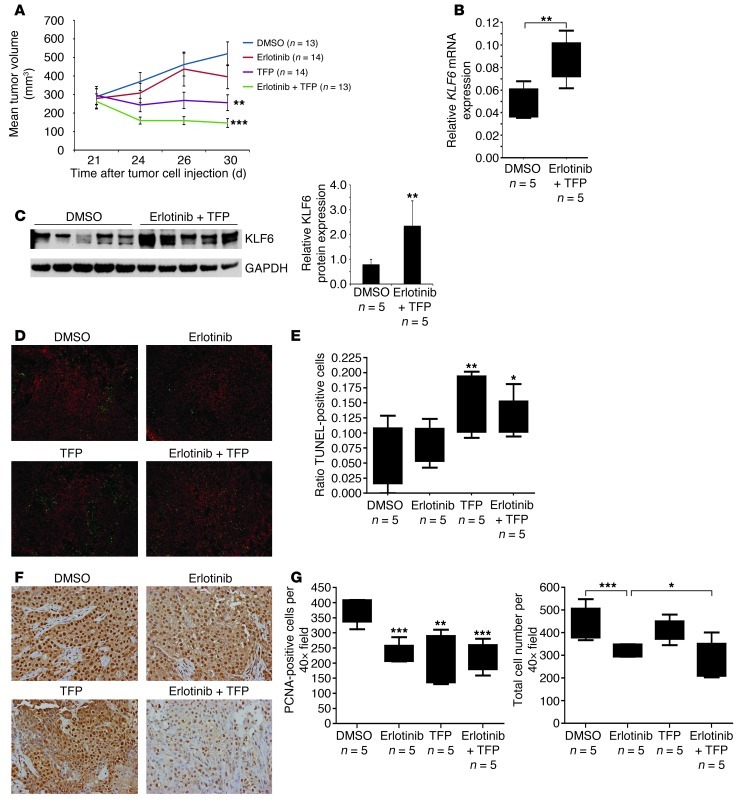
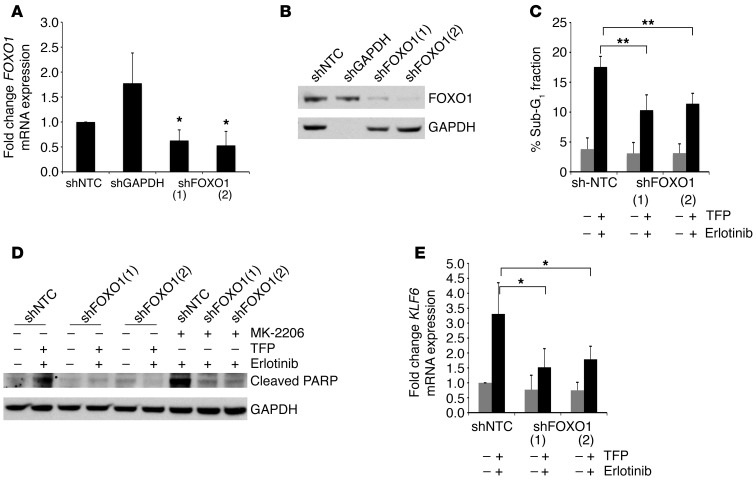
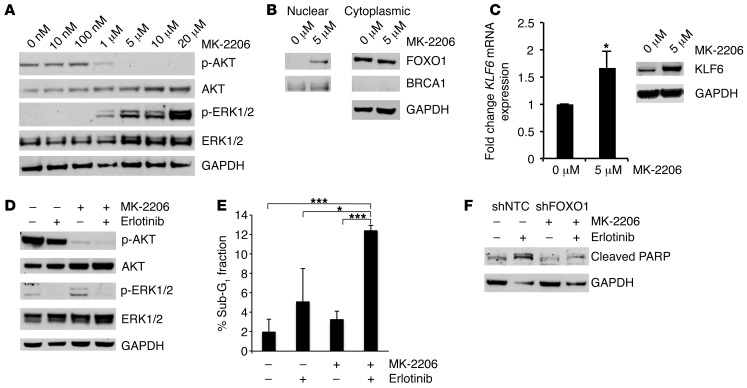
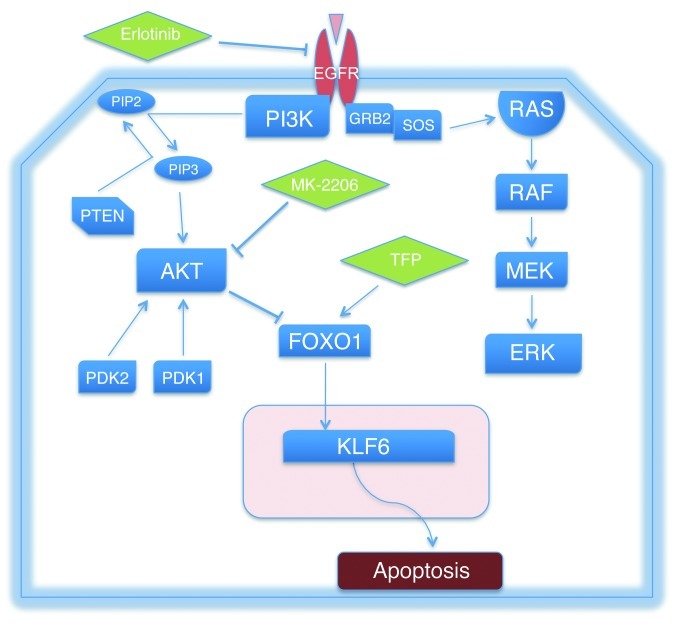
EGFR activation is both a key molecular driver of disease progression and the target of a broad class of molecular agents designed to treat advanced cancer. Nevertheless, resistance develops through several mechanisms, including activation of AKT signaling. Though much is known about the specific molecular lesions conferring resistance to anti-EGFR-based therapies, additional molecular characterization of the downstream mediators of EGFR signaling may lead to the development of new classes of targeted molecular therapies to treat resistant disease. We identified a transcriptional network involving the tumor suppressors Krüppel-like factor 6 (KLF6) and forkhead box O1 (FOXO1) that negatively regulates activated EGFR signaling in both cell culture and in vivo models. Furthermore, the use of the FDA-approved drug trifluoperazine hydrochloride (TFP), which has been shown to inhibit FOXO1 nuclear export, restored sensitivity to AKT-driven erlotinib resistance through modulation of the KLF6/FOXO1 signaling cascade in both cell culture and xenograft models of lung adenocarcinoma. Combined, these findings define a novel transcriptional network regulating oncogenic EGFR signaling and identify a class of FDA-approved drugs as capable of restoring chemosensitivity to anti-EGFR-based therapy for the treatment of metastatic lung adenocarcinoma.


Figures

Figure 1
Figure 1. Activated EGFR signaling regulates KLF6 transcription in lung adenocarcinoma.
(A) Patient-derived lung adenocarcinoma tumor samples with matched normal tissue adjacent to the retrieved tumor were evaluated for KLF6 mRNA expression by qRT-PCR using validated WT KLF6-specific primers and normalized to 3 independent housekeeping genes (GAPDH, actin, and 18S transcripts). Data are presented as fold change in KLF6 mRNA expression compared with the matched normal tissue for each sample pair. (B) Homogenized protein lysates from both tumor and normal samples were probed with a polyclonal KLF6 antibody and quantitated via densitometry. (C) Confirmation of human-derived transgenic EGFRL858R tetracycline-inducible expression in mouse lung tissue samples compared with WT littermates on a doxycycline-supplemented diet. Expression of human cDNA EGFRL858R expression was assessed using qRT-PCR with hEGFR-specific primers (n = 4). (D) Western blot of EGFRL858R tumor and WT littermate protein lysates confirming EGFR expression using a monoclonal EGFRL858R antibody. KLF6 protein expression normalized to tubulin is also shown. (E) qRT-PCR for KLF6 mRNA expression in L858R mouse lung tissue samples compared with WT littermates using mouse-specific KLF6 primers. (F) qRT-PCR for KLF6 mRNA expression in L858R mouse tumor samples after treatment with erlotinib compared with vehicle-treated control mice. Whiskers represent the range of expression, and the horizontal lines show the median. (G) Western blot for KLF6 and cleaved caspase-3 normalized to mouse tubulin for L858R mice tumor samples after treatment with erlotinib compared with vehicle. *P < 0.05, **P < 0.01, ***P < 0.001.
Figure 2
Figure 2. Activated EGFR signaling regulates KLF6 transcription in lung adenocarcinoma–derived cell lines.
(A) Dose-response curve representing the percentage of cells in the sub-G1 fraction as determined by flow cytometry analysis of propidium iodide staining for cellular DNA content. Each cell line was treated with erlotinib for 24 hours. For H3255, *P < 0.05, **P < 0.01, ***P < 0.001 compared with 0 nM; for HCC827, #P < 0.05, ##P < 0.01, ###P < 0.001 compared with 0 nM. (B) qRT-PCR for KLF6 mRNA expression normalized to GAPDH in 3 cell lines after treatment with 50 nM erlotinib. P < 0.05, P < 0.01. (C) Western blot for KLF6 and cleaved PARP protein expression in cell lines after treatment with 50 nM erlotinib.
Figure 3
Figure 3. Activated RAS signaling does not affect KLF6 expression.
(A) Western blot of lung tissue lysates extracted and microdissected from transgenic KrasLA2 mice to exclude obvious tumor nodules versus lung tissue lysates of WT littermates. Tumor nodules were excluded to ensure that any changes in KLF6 were not secondary to tumor formation. Western blot shows p-ERK, ERK, and KLF6 protein expression normalized to mouse tubulin. (B) p-ERK to ERK ratios determined by quantitating protein expression from A. (C) qRT-PCR of KLF6 expression in lung tissue lysates of KrasLA2 mice versus WT littermates performed as previously described. For B and C, whiskers represent the range of expression, while the horizontal line shows the median. (D) Western blot for p-ERK, ERK, KLF6, and GAPDH in the HCC827 cell line treated with 1 μM of the MEK inhibitor AZD6244. (E) qRT-PCR for KLF6 in the HCC827 cell line treated with 1 μM AZD6244, normalized to GAPDH. ***P < 0.001.
Figure 4
Figure 4. Activated AKT signaling negatively regulates KLF6 expression.
(A) Western blotting of lung tissue lysates from Pten+/– and WT age-matched littermates for PTEN, p-AKT, AKT, p-FOXO1, FOXO1, and KLF6 normalized to tubulin. (B) Box-and-whisker plots of p-AKT/AKT and p-FOXO1/FOXO1 protein ratios in A. (C) qRT-PCR of KLF6 mRNA expression in Pten-heterozygous animals as compared with WT littermates. (D) Western blot for p-AKT, AKT, KLF6, and GAPDH in the HCC827 cell line treated with 1 μM of the allosteric AKT inhibitor MK-2206 for 24 hours. (E) qRT-PCR for KLF6 mRNA expression normalized to GAPDH in the HCC827 cell line treated with 1 μM MK-2206 for 24 hours. (F) Promoter activity shown as fold change compared with baseline as determined by luciferase expression in the A549 cell line 48 hours after co-transfection of the KLF6 promoter construct with either pBABE control or constitutively active AKTmyr expression vector. (G) qRT-PCR for KLF6 mRNA expression normalized to GAPDH in A549 cells 48 hours after transfection with either pBABE control or constitutively active AKTmyr. (H) Western blot for p-AKT, AKT, and KLF6 normalized to GAPDH in A549 cells 48 hours after transfection with either pBABE control or constitutively active AKTmyr. *P < 0.05, **P < 0.01.
Figure 5
Figure 5. Activated EGFR signaling regulates KLF6 expression via the transcription factor FOXO1.
qRT-PCR for (A) FOXO1 and (C) KLF6 mRNA expression in A549 cells transiently transfected with pCINEO-FOXO1 construct and analyzed after 48 hours. Data are shown as fold change in mRNA expression compared with control empty vector–transfected cells and normalized to GAPDH. (B) KLF6 promoter activity measured by a dual-reporter assay in the presence of FOXO1 overexpression in A549 cells. Data are shown as fold change compared with empty vector–transfected cells. (D) Western blot for KLF6, FOXO1, and GAPDH protein expression after transfection with pCI-neo-FOXO1 construct and pCI-neo empty control vector in A549 cells. (E) EGFR/FOXO1/KLF6 signaling pathway represented by protein Western blot for p-EGFR, EGFR, p-AKT, AKT, p-FOXO1, FOXO1, KLF6, PARP, and GAPDH in HCC827 cells 24 hours after treatment with erlotinib. (F) Western blot for FOXO1, KLF6, histone H3, and GAPDH in HCC827 cells treated with 50 nM erlotinib for 24 hours and subjected to nuclear/cytoplasmic fractionation. Values represent relative protein expression, normalized to histone H3. (G and H) qRT-PCR for FOXO1 and KLF6 mRNA expression normalized to GAPDH in HCC827 cells after transfection with sequence-specific siRNAs to FOXO1 or small, interfering non-targeting control (siNTC) and subsequent treatment with erlotinib. (I) Western blot for FOXO1, KLF6, and the apoptotic marker caspase-3, normalized to GAPDH in HCC827 cells after transfection with sequence-specific siRNAs to FOXO1 or control siNTC and subsequent treatment with erlotinib. *P < 0.05, **P < 0.01, ***P < 0.001.
Figure 6
Figure 6. Targeted reduction of KLF6 in the erlotinib-sensitive HCC827 cell line confers drug resistance in culture and in vivo.
(A) qRT-PCR for KLF6 mRNA expression in HCC827 cells treated with 50 nM erlotinib normalized to GAPDH over 24 hours. (B) Western blot for KLF6 and cleaved PARP expression in HCC827 cells treated with erlotinib over for 24 hours. (C) Cell cycle analysis using flow cytometry of the sub-G1 fraction after propidium iodide staining. (D) qRT-PCR for KLF6 mRNA expression in the control cell line shLuc-HCC827 and stable knockdown cell line shKLF6-HCC827 after treatment with 50 nM erlotinib. (E) Western blot for expression of KLF6, cleaved PARP, p-AKT, p-ERK. (F) Cell cycle analysis using flow cytometry of the sub-G1 cell cycle fraction after propidium iodide staining. (G) Clonogenic assay of shLuc-HCC827 and shKLF6-HCC827 cells treated with 0 or 50 nM erlotinib for 7 days; quantification of colonies is presented. (HJ) Growth curves of subcutaneous xenograft tumors generated from 1 × 10⁷ shLuc-HCC827 or shKLF6-HCC827 cells injected into the right posterior flank of nude mice following an initial growth period of 14 days. Group tumor volume (n = 4) averaged 150 mm3 prior to treatment. Tumor measurements were made 48 hours after each injection. (H) Fold change of tumor volume over the duration of treatment described above represented as a box-and-whisker plot. (I) Mean tumor volume of shLuc-HCC827 xenograft tumors treated with DMSO (vehicle control) or erlotinib (25 mg/kg). (J) Mean tumor volume of shKLF6-HCC827 xenograft tumors treated with DMSO or erlotinib (25 mg/kg). *P < 0.05, **P < 0.01, ***P < 0.001.
Figure 7
Figure 7. Inhibition of FOXO1 nuclear export results in KLF6 upregulation and increased induction of apoptosis in combination with erlotinib.
(A) Western blot for FOXO1, BRCA1, and GAPDH after nuclear cytoplasmic fractionation of H1650 cells treated with 20 μM TFP. BRCA1: nuclear fraction control, GAPDH: cytoplasmic fraction control. (B) qRT-PCR and Western blotting for KLF6 mRNA and protein expression levels in H1650 cells after treatment with TFP. (C) Isobologram analysis of combination treatment with erlotinib and TFP in H1650 cells performed using normalized equivalents of single agents. The IC50 values for each drug are plotted on the x and y axes, respectively. The line connecting the points is the theoretical line of additivity. The experimental values of the fixed dose ratios of TFP/erlotinib combinations (diamonds) were significantly below the respective additive points. *P < 0.05.
Figure 8
Figure 8. TFP and erlotinib administered in combination decrease tumorigenicity in a xenograft model of lung adenocarcinoma.
(A) Growth curves of xenograft tumors generated by injection of 5 × 10⁶ H1650 lung adenocarcinoma cells into the right posterior flank of nude mice. Following an initial growth period of 21 days, group tumor volume (n = 14) averaged 200 mm3 prior to treatment. Tumor measurements were made 48 hours after each injection. Data indicate growth curves with DMSO (vehicle control), erlotinib (25 mg/kg), TFP (10 mg/kg), and a combination of TFP and erlotinib. Asterisks represent significance compared with DMSO. (B) qRT-PCR for KLF6 mRNA expression from previously described tumors homogenized after the H1650-injected nude mice were sacrificed 24 hours after final treatment. (C) Western blot analysis of KLF6 expression in homogenized tumor samples (described above). Lysate homogenates from treated and untreated tumors were run and probed in parallel (n = 5) and results normalized to GAPDH. (D) Representative images (original magnification, ×10) of xenograft tumor histology paraffin sections subjected to TUNEL for detection of apoptosis. (E) Cells positive for TUNEL were quantified with NIS-Elements and normalized to nuclear counterstaining by propidium iodide. Quantification is shown for each treatment group. (F) Paraffin histology sections subjected to immunohistochemistry for PCNA. Representative images are shown (original magnification, ×40). (G) Positive nuclear staining, colocalizing with nuclear counterstain hematoxylin, quantified with ImageJ software. Data are shown in box-and-whisker plots for each treatment group. *P < 0.05, **P < 0.01, ***P < 0.001.
Figure 9
Figure 9. Targeted reduction of FOXO1 in the H1650 cell line confers drug resistance to TFP and erlotinib treatment.
(A) qRT-PCR for FOXO1 mRNA expression in the control cell line shNTC-H1650 and stable knockdown cell lines shGAPDH-H1650, shFOXO1(1)-H1650, and shFOXO1(2)-H1650. (B) Western blot for FOXO1 expression in shNTC-H1650, shGAPDH-H1650, shFOXO1(1)-H1650, and shFOXO1(2)-H1650 cells. (C) Cell cycle analysis using flow cytometry of the sub-G1 fraction after propidium iodide staining in shNTC-H1650, shFOXO1(1)-H1650, and shFOXO1(2)-H1650 cells after treatment with TFP and erlotinib. (D) Western blot for cleaved PARP in shNTC-H1650, shFOXO1(1)-H1650, and shFOXO1(2)-H1650 cells after treatment with TFP and erlotinib as well as with MK-2206 and erlotinib. (E) qRT-PCR for KLF6 mRNA expression in shNTC-H1650, shFOXO1(1)-H1650, and shFOXO1(2)-H1650 cells after treatment with TFP and erlotinib. *P < 0.05, **P < 0.01.
Figure 10
Figure 10. Targeted reduction of FOXO1 in the H1650 cell line confers drug resistance to MK-2206 and erlotinib treatment.
(A) Western blotting for p-AKT, AKT, p-ERK, and ERK in H1650 cells after treatment with increasing doses of MK-2206. (B) Western blotting for FOXO1, BRCA1, and GAPDH after nuclear cytoplasmic fractionation of the H1650 cell line treated with 5 μM MK-2206. BRCA1: nuclear fraction control; GAPDH: cytoplasmic fraction control. (C) qRT-PCR and Western blotting for KLF6 mRNA and protein expression levels in H1650 cells after treatment with MK-2206. (D) Western blotting for p-AKT, AKT, p-ERK, and ERK in H1650 cells after treatment with erlotinib, MK-2206, or a combination of erlotinib and MK-2206. (E) Cell cycle analysis using flow cytometry of the sub-G1 cell cycle fraction after propidium iodide staining after treatment of H1650 cells with erlotinib, MK-2206, or a combination of erlotinib and MK-2206. (F) Western blot for cleaved PARP in shNTC-H1650 and shFOXO1-H1650 cells after MK-2206 and erlotinib treatment. *P < 0.05, ***P < 0.001.
Figure 11
Figure 11. The EGFR/AKT/FOXO1/KLF6 signaling axis and associated inhibitors utilized to determine functional relationships among the signaling components of the cascade.
GRB2, growth factor receptor–bound protein 2; SOS, Son of Sevenless.

References

    1. Kobayashi S, et al. EGFR mutation and resistance of non-small-cell lung cancer to gefitinib. N Engl J Med. 2005;352(8):786–792. doi: 10.1056/NEJMoa044238. - DOI - PubMed
    1. Pao W, et al. Acquired resistance of lung adenocarcinomas to gefitinib or erlotinib is associated with a second mutation in the EGFR kinase domain. PLoS Med. 2005. 2 3 e73 . 10.1371/journal.pmed.0020073 - DOI - PMC - PubMed
    1. Shepherd FA, et al. Erlotinib in previously treated non-small-cell lung cancer. N Engl J Med. 2005;353(2):123–132. doi: 10.1056/NEJMoa050753. - DOI - PubMed
    1. Pao W, et al. KRAS mutations and primary resistance of lung adenocarcinomas to gefitinib or erlotinib. PLoS Med. 2005. 2 1 e17 . 10.1371/journal.pmed.0020017 - DOI - PMC - PubMed
    1. Endoh H, Yatabe Y, Kosaka T, Kuwano H, Mitsudomi T. PTEN and PIK3CA expression is associated with prolonged survival after gefitinib treatment in EGFR-mutated lung cancer patients. J Thorac Oncol. 2006;1(7):629–634. doi: 10.1097/01243894-200609000-00006. - DOI - PubMed

Publication types

MeSH terms