

doi: 10.1093/eurheartj/ehs095.
Epub 2012 May 31.
Expert review document part 2: methodology, terminology and clinical applications of optical coherence tomography for the assessment of interventional procedures
Affiliations
- PMID: 22653335
- PMCID: PMC3470836
- DOI: 10.1093/eurheartj/ehs095
Item in Clipboard
Expert review document part 2: methodology, terminology and clinical applications of optical coherence tomography for the assessment of interventional procedures
Eur Heart J.
2012 Oct.
No abstract available
Figures
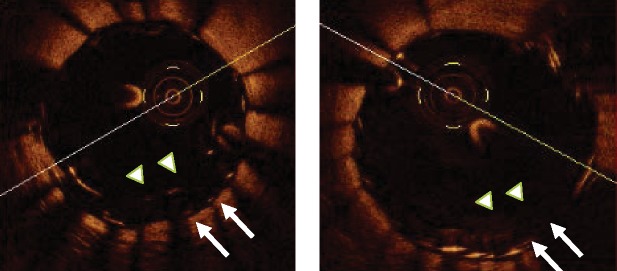
Left panel: Stent overlapping in the left anterior descending artery. Despite an optimal angiographic result, optical coherence tomography shows a malapposition of the proximal edge of the distal stent, with a 430 µ distance from the inner (arrow heads) to the outer struts (arrows). Right panel: the optical coherence tomography image of the same cross section obtained after additional high pressure inflation with a non-compliant oversized balloon shows a correction of the malapposition.
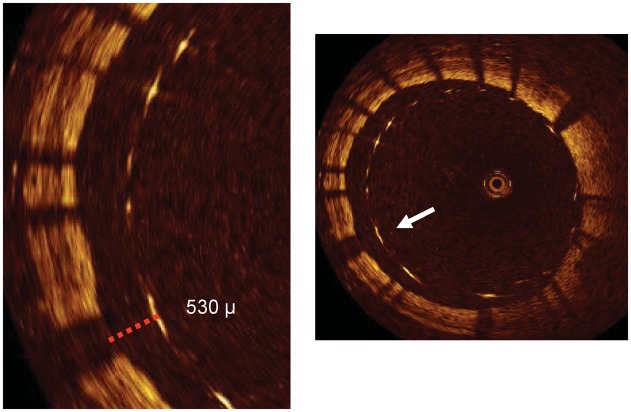
An optical coherence tomography cross section of a stent immediately following implantation in the right coronary artery. The stent struts are clearly visible. There are struts that are apposed to the vessel wall. However, what is clearly evident is a group of stent struts (between 4 and 12 o'clock) which are grossly malapposed to the vessel wall. Optical coherence tomography cannot penetrate through metallic structures and hence only shows the endoluminal aspect of the stent strut. To be classified as malapposed, the strut must not be in contact with the vessel wall with the distance between the endoluminal aspect and the vessel wall greater than the known thickness of the stent strut itself, including the polymer thickness (arrow in the right panel and dotted line in the left panel with a magnified view).
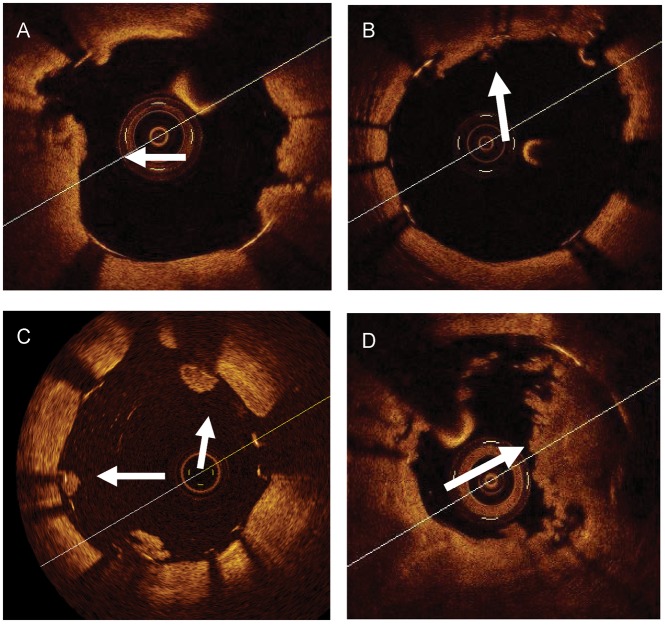
Examples of intra-stent thrombotic formations and a plaque prolapse. (A and B) A tissue protrusion. Arrows show tissue prolapsed between stent struts and extending inside a circular arc, connecting adjacent struts. (C) Intra-luminal globular protrusions at stent strut locations with no direct continuation from the surface of the vessel wall (arrows). (D) A marked intra-stent thrombosis observed in a drug eluting stents at a late follow-up. Arrows show an intra-stent mass with an irregular inner border. Images in (A) and (D) were obtained with frequency domain optical coherence tomography, those in (B) and (C) with time domain optical coherence tomography.
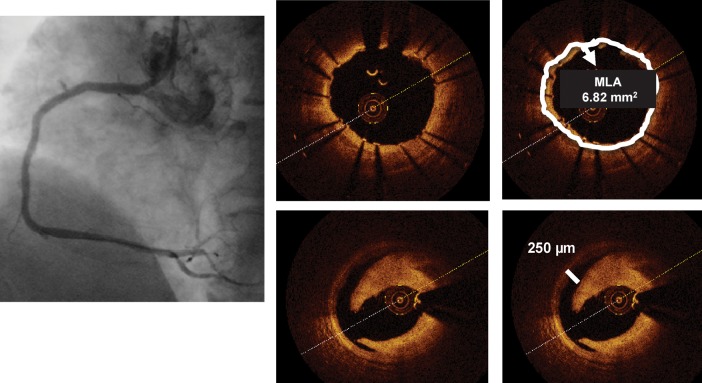
Left panel: Cypher stent deployed in the mid-right coronary artery with an optimal final angiographic result. Optical coherence tomography (right inferior panels) shows a moderate dissection distal to the stent ending, missed by angiography. The distance between the rim of the dissection and the vessel wall is 250 µm (line), slightly above the resolution of intravascular ultrasound, while the circumferential extension of the plaque dissection is 90°. The right upper panels are obtained at the stent minimum lumen area and show a well-apposed stent with an MLA of 6.82 mm2.
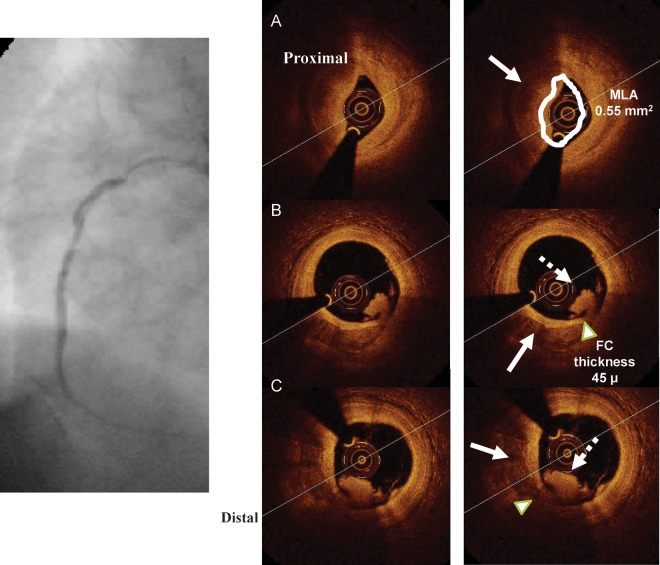
The figure shows optical coherence tomography potentialities to detect components of ruptured plaques. Left panel shows a suboccluded right coronary artery in a patient with an inferior myocardial infarction. Optical coherence tomography cross sections (B) and (C) were obtained at the site of a plaque rupture and show a plaque with mixed composition (calcium + lipid) (arrow). At the shoulder of the plaque, at the site of minimum thickness of the fibrous cap (arrow head), an intra-luminal thrombotic formation is shown (dotted arrow). (A) A severe reduction in the lumen area due to a marked concentric thrombotic formation. As the penetration of optical coherence tomography through a thrombus is limited, vessel media cannot be studied (arrow).
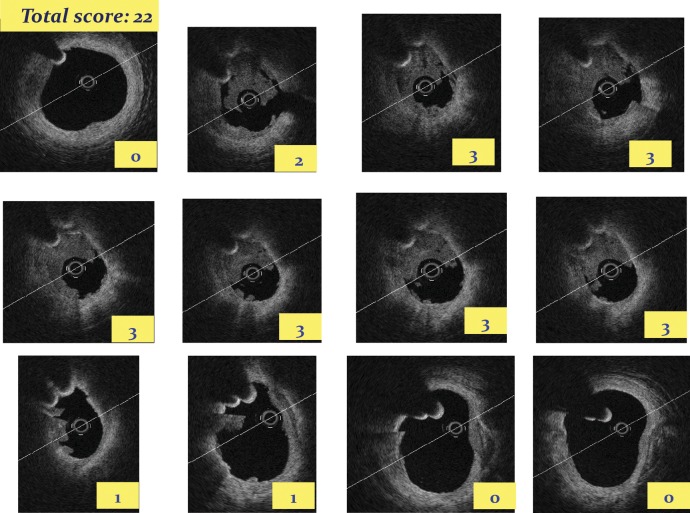
The application of a score based on the semi-quantitative assessment of a thrombus (number of the involved quadrants on the cross-sectional optical coherence tomography images) and the longitudinal extension of the thrombus itself. By applying this semi-quantitative grading, in each cross section, a thrombus is classified as absent or subtending 1, 2, 3, or 4 quadrants. The score is then calculated as the sum of each cross-section score.
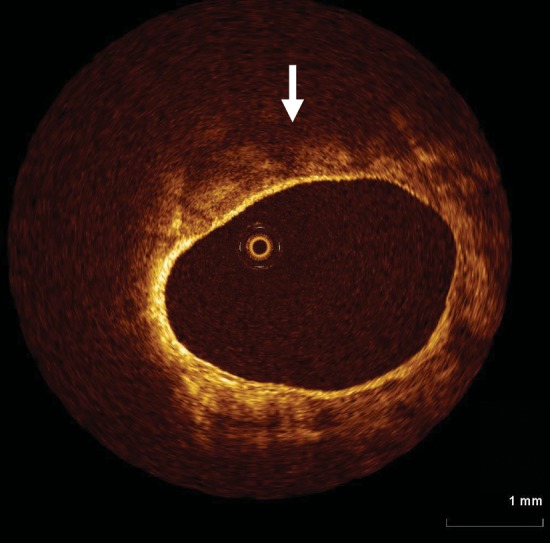
Optical coherence tomography is very well versed at detecting microstructures in close proximity to the vessel wall. Its limited tissue penetration (<1.5 mm), however, means that the extent of plaque is unable to be determined. In this example, diffuse, poorly reflective tissue is seen consistent with a lipid rich plaque (arrow), however, its extent beyond 1 mm from the vessel wall is limited.
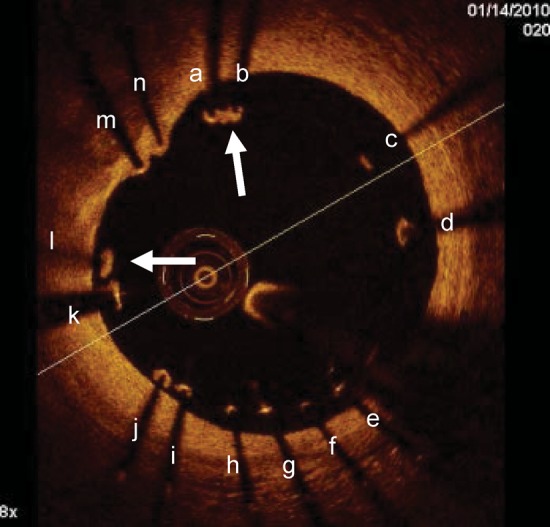
Malapposed struts tend not to heal with tissue coverage unlike well-apposed ones. Optical coherence tomography images obtained 1 month after Taxus stent deployment in the right coronary artery. Optical coherence tomography showed malapposition of the drug eluting stents with many struts not adhering at the vessel wall. The vast majority of malapposed struts (from a to l) were uncovered while only two of them (arrows) had some tissue coverage. On the other hand the two well-apposed struts (m, n) were covered.
References
-
- Prati F, Regar E, Mintz GS, Arbustini A, Di Mario C, Jang IK, Akasaka T, Costa M, Guagliumi G, Grube E, Ozaki Y, Pinto F, Serruys PWJ for the Expert's OCT Review Document. Expert review document on methodology and clinical applications of OCT. Physical principles, methodology of image acquisition and clinical application for assessment of coronary arteries and atherosclerosis. Eur Heart J. 2010;31:401–415. - PubMed
-
- Jang IK, Bouma BE, Kang DH, Park SJ, Park SW, Seung KB, Choi KB, Shishkov M, Schlendorf K, Pomerantsev E, Houser SL, Aretz HT, Tearney GJ. Visualization of coronary atherosclerotic plaques in patients using Optical Coherence Tomography: comparison with intravascular ultrasound. J Am Coll Cardiol. 2002;39:604–609. - PubMed
-
- Takarada S, Imanishi T, Liu Y, Ikejima H, Tsujioka H, Kuroi A, Ishibashi K, Komukai K, Tanimoto T, Ino Y, Kitabata H, Kubo T, Nakamura N, Hirata K, Tanaka A, Mizukoshi M, Akasaka T. Advantage of next-generation frequency-domain optical coherence tomography compared with conventional time-domain system in the assessment of coronary lesion. Catheter Cardiovasc Interv. 2010;75:202–206. - PubMed
MeSH terms
LinkOut - more resources
Full Text Sources
Other Literature Sources
Medical
