. 2012 Mar-Apr;4(2):167-72.
doi: 10.4161/isl.19256. Epub 2012 Mar 1.

Quantification of islet size and architecture

Affiliations

Quantification of islet size and architecture

German Kilimnik et al. Islets. 2012 Mar-Apr.

Abstract

Human islets exhibit distinct islet architecture particularly in large islets that comprise of a relatively abundant fraction of α-cells intermingled with β-cells, whereas mouse islets show largely similar architecture of a β-cell core with α-cells in the periphery. In humans, islet architecture is islet-size dependent. Changes in endocrine cell mass preferentially occurred in large islets as demonstrated in our recent study on pathological changes of the pancreas in patients with type 2 diabetes. ( 1) The size dependency of human islets in morphological changes prompted us to develop a method to capture the representative islet distribution in the whole pancreas section combined with a semi-automated analysis to quantify changes in islet architecture. The computer-assisted quantification allows detailed examination of endocrine cell composition in individual islets and minimizes sampling bias. The standard immunohistochemistry based method is widely applicable to various specimens, which is particularly useful for large animal studies but is also applied to a large-scale analysis of the whole organ section from mice. In this article, we describe the method of image capture, parameters measured, data analysis and interpretation of the data.


Figures
None
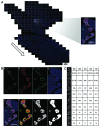
Figure 1. Large-scale capture and computer-assisted semi-automated analysis of the whole tissue section. (A) Virtual slice view of a human pancreatic section (female, 66-y old) immunostained for insulin (green), glucagon (red), somatostatin (white) and nuclei (blue). A series of contiguous images of a specimen is collected (illustrated as boxed panels) and merged into a single image montage (i.e., virtual slice; arrowed). A composite is made by merging four overlapping virtual slice images. Shown on the right is an example of a detailed regional view that contains several islets including a small cluster of β-cells. (B) Views of each channel showing cellular composition: a. β-cells; b. α-cells; c. δ-cells; d. nuclei; and e. a composite of all three endocrine cells and nuclei. Note that there is no overlap among the endocrine cell fractions. (B, f) Reconstructed endocrine cell distribution within each islet based on the captured center coordinates of each cell type within the given islet, which parameter can be used to count the number of each endocrine cell type and analyze cellular composition and geographic islet architecture. (B, g) Total endocrine cell area shown as a converted 8-bit mask after automatic thresholding. (B, h) Total islet area that includes unstained fractions such as intraislet capillary. (C) Table summarizing data obtained through the computer-assisted large-scale analysis. Note that each islet including a small cluster is designated with an identification number so that specific information on a given structure can be obtained.
None
Figure 2. Islet size dependent changes of endocrine cellular composition in human islets. (A) Left, mouse pancreas (a CD-1 female mouse at 3-mo). Relative frequency of islet size (gray bar) and ratios of α (red), β (green), and δ (blue) cells within islets are plotted against islet size; means ± SEM. Note that islet size is presented as a logarithmic scale considering the high number of small islets and the low number of large islets. In addition, islet area is divided by the single-cell area (170 μm2 ; 7) to make them as dimensionless values representing the number of cells in a given islet area. See the conversion between logarithmic islet area (logarithmic) and effective diameter (μm). Right, human pancreas (same as in Figure 1). While small islets show the similar endocrine cell composition of the dominant fraction of β-cells in mouse islets, α- and δ-cell fractions increase in large islets in humans. (B) Fraction of islet size distribution (gray bar) and fraction of total islet area (red line). (C) The contribution of large islets to the total endocrine cell area is plotted with the cutoff points in islet size of > 60, 100 and 150 μm in diameter (left, mouse; right, human corresponding to Figure 2B).
None
Figure 3. Islet size and shape distribution. Three-dimensional scatter plots. Each dot represents a single islet/cluster with reference to size (area) and shape (circularity and Feret’s diameter). The density of islets is color-coded from sparse to dense. (A) Right, a 15-y old male with BMI = 16. Left, a 51-y old female with BMI = 29. (B) Left, a non-diabetic 63-y old female. Right, a 66-y old female with T2D.
None
Figure 4. Characterization of islet architecture. (A) Cell-cell distance distributions between α-cells (+; red), α- and β-cells ( × ; blue), and β-cells (*; green) in Model 1, Model 2, and representative mouse and human islets. Three-dimensional positions of α- (red) and β-cells (green) in isolated islets were determined by confocal microscopy. (B) A schematic diagram to show how to calculate cell-cell contact probabilities between α-cells (Pαα), β-cells (Pββ), and α- and β-cells (Pαβ) in an islet. (C) Cellular compositions of α-cells (Pα) and β-cells (Pβ); and cell-cell contact probabilities were calculated for the above Model 1, Model 2, mouse, and human islets. Note that PαPα, PβPβ, and 2PαPβ in the parentheses correspond to the cell-cell contact probabilities in the case of a random mixture of α- and β-cells for the given Pα and Pβ.

Comment on

  • Kilimnik G, Zhao B, Jo J, Periwal V, Witkowski P, Misawa R, et al. Altered islet composition and disproportionate loss of large islets in patients with type 2 diabetes. PLoS One. 2011;6:e27445. doi: 10.1371/journal.pone.0027445.

References

    1. Kilimnik G, Zhao B, Jo J, Periwal V, Witkowski P, Misawa R, et al. Altered islet composition and disproportionate loss of large islets in patients with type 2 diabetes. PLoS One. 2011;6:e27445. doi: 10.1371/journal.pone.0027445. - DOI - PMC - PubMed
    1. Kilimnik G, Kim A, Jo J, Miller K, Hara M. Quantification of pancreatic islet distribution in situ in mice. Am J Physiol Endocrinol Metab. 2009;297:E1331–8. doi: 10.1152/ajpendo.00479.2009. - DOI - PMC - PubMed
    1. Miller K, Kim A, Kilimnik G, Jo J, Moka U, Periwal V, et al. Islet formation during the neonatal development in mice. PLoS One. 2009;4:e7739. doi: 10.1371/journal.pone.0007739. - DOI - PMC - PubMed
    1. Kim A, Kilimnik G, Hara M. In situ quantification of pancreatic beta-cell mass in mice. J Vis Exp 2010; 40. pii: 1970. doi: 10.3791/1970. - PMC - PubMed
    1. Kim A, Kilimnik G, Guo C, Sung J, Jo J et al. Computer-assisted large-scale visualization and quantification of pancreatic islet mass, size distribution and architecture. J Vis Exp 2011; 49. pii: 2471. doi: 10.3791/2471. - PMC - PubMed

Publication types

LinkOut - more resources