. 2012 Sep;42(9):2383-94.
doi: 10.1002/eji.201142072. Epub 2012 Aug 6.

Rapid early innate control of hepatitis C virus during IFN-α treatment compromises adaptive CD4+ T-cell immunity

Affiliations

Rapid early innate control of hepatitis C virus during IFN-α treatment compromises adaptive CD4+ T-cell immunity

Tom Pembroke et al. Eur J Immunol. 2012 Sep.

Abstract

The ability to control HCV with IFN-α-based treatments provides an opportunity in humans to study how the rate of viral clearance in vivo impinges on the development of antiviral responses. Ex vivo (IFN-γ-producing) and cultured antiviral CD4(+) T cells, serum cytokines, and viral loads were measured repeatedly in a cohort of chronically HCV-infected subjects (n = 33) receiving IFN-α. Rapid control of virus indicated by an increased calculated rate of virus clearance, occurred in those subjects demonstrating absent/minimal T-cell responses (p < 0.0006). Surprisingly, in subjects who demonstrated the most robust T-cell responses (and reduced serum IL-10), there was actually a reduced rate of early virus clearance. A subsequent analysis of NK-cell function in available subjects (n = 8) revealed an inverse correlation between pretreatment NK-cell expression of NKp46 and the potential to upregulate cytotoxic function on exposure to IFN-α (p < 0.004), as well as the subsequent measured rate of viral clearance (p = 0.045). Thus, the CD4(+) T-cell response during IFN-α treatment appears to be shaped by the rate of innate virus suppression. These data suggest that individuals who respond most effectively to immune intervention may be most in need of subsequent vaccination to prevent reinfection.


Figures

Figure 1
Figure 1
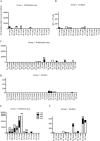
Ex vivo ELISpot (IFN-γ-producing) and cultured T-cell responses in patients undergoing treatment for HCV. Proliferation and ELISpot assays to HCV antigens; core,NS3, NS4, and NS5 were measured at multiple early (days 2, 7, 14, 21, and 28) or late (weeks 12, 24, and 48) time points. (A and B) Group 1 (n = 9) shows results for patients who failed treatment. (C and D) Group 2 (n = 17) shows patients who successfully cleared virus but with an absent or minimal CD4+ T-cell response. (E and F) Group 3 (n = 7) shows patients who successfully cleared virus with robust CD4+ T-cell responses.
Figure 2
Figure 2
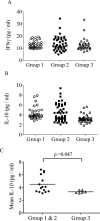
Serum IFN-γ and IL-10 measured over the first 28 days. Serum cytokines were measured at multiple time points over the first 28 days of treatment. Results of multiple samples taken from 21 individuals (n = 6, Group 1; n = 9, Group 2; n = 6, Group 3) of (A) serum IFN-γ and (B) serum IL-10 levels are shown. (C) Mean IL-10 levels for each subject in each group were compared revealing a significant decrease in subjects from Group 3 (p = 0.047 unpaired t-test).
Figure 3
Figure 3
The kinetics of viral clearance. Serum was collected at multiple time points (days 0, 2, 7, 14, 21, 28, and then 3 monthly) and viral load measured. (A) Representative examples of viral clearance are shown for a patient from each of the three groups. k (day−1) is the rate constant for the viral clearance, the higher value indicating more rapid clearance of virus. The rate constant k in day−1 of viral clearance is calculated on these curves. Group 1 patient, k = 0.08 day−1; Group 2, patient k = 4.162 day−1; Group 3 patient, k = 0.51 day−1. (B) Viral clearance shown on a logarithmic scale for a representative patient from each group over the first 28 days of treatment. (C) Summary of all the rate constants calculated as in (A) for each group (Group 1, n = 9; Group 2, n = 17; Group 3, n = 7). Data are shown as median (bar), 25th and 75th interquartile (box) and range (whiskers) of the indicated number of samples. The rapid clearance was greatest in Group 2 (p = 0.0006, one-way ANOVA).
Figure 4
Figure 4
NK-cell phenotype in patients prior to commencing treatment. (A) Representative plots from a patient in Group 2 (top) and Group 1 (bottom) of NK-cell degranulation (CD107a expression) on exposure to a weak stimulus (Huh7.5 cells/50 U IFN-α) and a strong stimulus (K562 cells/1000 U IFN-α). The fold increase in degranulation from a weak to a strong stimulus is far more marked for the Group 3 patient. This was expressed as NK responsiveness = % degranulation with strong stimulus/% degranulation with weak stimulus. Group 2 (top) patient NK responsiveness = 38.4/7.54 = 5.1. Group 1 (bottom) patient = 34.9/28.2 = 1.3. (B) NK-cell NKp46 expression and NK responsiveness (r2 = 0.78, p < 0.004). (C) NKp46 expression and the rate of viral clearance during IFN-α treatment of HCV (r2 = 0.85, p = 0.001). (D) NK responsiveness and the rate of viral clearance (r2 = 0.51, p < 0.05). (E) Peripheral blood NKp46 expression and intrahepatic NKp46 expression (r2 = 0.7, p < 0.0001). These patient samples do not overlap with the treated cohort.

Similar articles

Cited by

References

    1. Randall RE, Goodbourn S. Interferons and viruses: an interplay between induction, signalling, antiviral responses and virus countermeasures. J. Gen. Virol. 2008;89:1–47. - PubMed
    1. Kalams SA, Walker BD. The critical need for CD4 help in maintaining effective cytotoxic T lymphocyte responses. J. Exp. Med. 1998;188:2199–2204. - PMC - PubMed
    1. Thursz M, Yallop R, Goldin R, Trepo C, Thomas H. Influence of MHC class II genotype on outcome of infection with hepatitis C virus. Lancet. 1999;354:2119–2124. - PubMed
    1. Botarelli P, Brunetto M, Minutello M, Calvo P, Unutmaz D, Weiner A, Choo Q, et al. T-lymphocyte response to hepatitis C virus in different clinical courses of infection. Gastroenterology. 1993;104:580–587. - PubMed
    1. Cramp M, Rossol S, Chokshi S, Carucci P, Williams R, Naoumov N. Hepatitis C virus-specific T-cell reactivity during interferon and ribavirin treatment in chronic hepatitis C. Gastroenterology. 2000;118:346–355. - PubMed

Publication types

MeSH terms