. 2012 Jun 1;336(6085):1164-8.
doi: 10.1126/science.1218062.

Rocket launcher mechanism of collaborative actin assembly defined by single-molecule imaging

Affiliations

Rocket launcher mechanism of collaborative actin assembly defined by single-molecule imaging

Dennis Breitsprecher et al. Science. .

Abstract

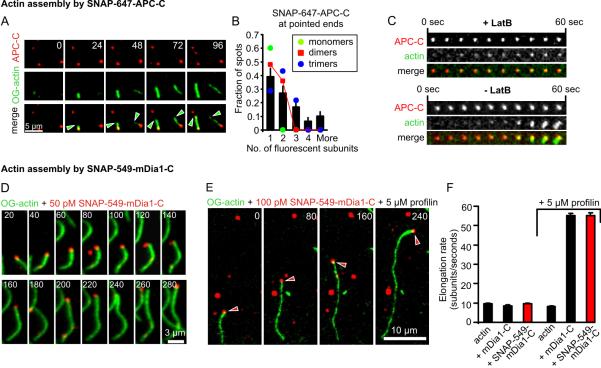
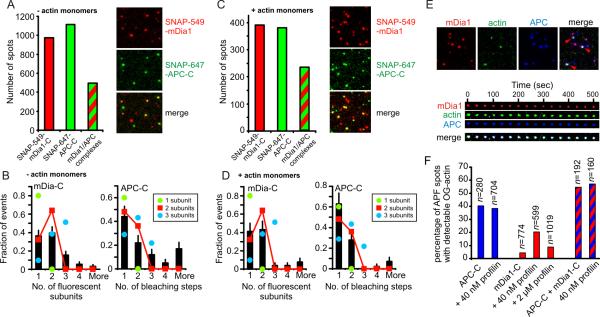
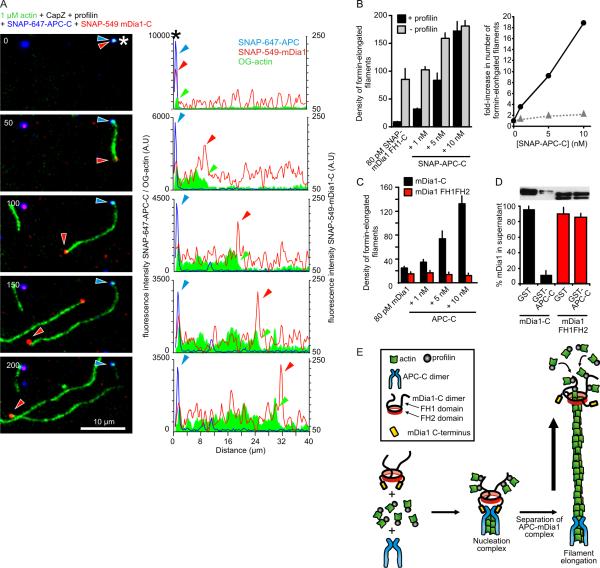
Interacting sets of actin assembly factors work together in cells, but the underlying mechanisms have remained obscure. We used triple-color single-molecule fluorescence microscopy to image the tumor suppressor adenomatous polyposis coli (APC) and the formin mDia1 during filament assembly. Complexes consisting of APC, mDia1, and actin monomers initiated actin filament formation, overcoming inhibition by capping protein and profilin. Upon filament polymerization, the complexes separated, with mDia1 moving processively on growing barbed ends while APC remained at the site of nucleation. Thus, the two assembly factors directly interact to initiate filament assembly and then separate but retain independent associations with either end of the growing filament.


Figures

Figure 1
Figure 1. Single molecule analysis of the APC-C- and mDia1-C mediated actin assembly processes
(A) Dual-color TIRFM of OG-actin filaments (1 μM, 10% labeled, green) originating from SNAP-647-APC-C-spots (10 nM, red). Green arrowheads mark the growing barbed ends. (B) Fluorescence intensity analysis of number of SNAP-647-APC-C subunits at filament ends. (C) Micrographs of OG-actin accumulation at SNAP-647-APC-C spots in absence and presence of latB. (D, E) Dual-color TIRFM of OG-actin filaments (1 μM, 10% labeled, green) being elongated by single SNAP-549-mDia1-C molecules (red) without (D) and with (E) profilin. Time is given in seconds. Red arrowheads in E mark the formin molecule associated with the barbed end. (F) Average elongation rates of mDia1-C and SNAP-549-mDia1-C-assembled filaments without and with profilin. Error bars represent SE, n ≥ 12, N=3.
Figure 2
Figure 2. Association of APC-C and mDia1-C and formation of tripartite complexes with G-actin
(A) Colocalization of SNAP-647-APC-C and SNAP-549-mDia1-C in surface adsorbed complexes. The proteins (200 nM each) were preincubated for 10 min, diluted 200-fold, and visualized by TIRFM. Spots emitting fluorescence from SNAP-549, SNAP-647 or both were counted. (B) Oligomeric state of APC-C/mDia1-C complexes (n = 91) determined by fluorescence intensity analysis for mDia1-C and photobleaching step analysis for APC-C (see methods). (C,D) Identical to A and B, except that 20 μM latB-sequestered actin monomers were included during pre-incubation (100 nM in final reaction). In D, n = 43. Error bars represent SE. (E) Tripartite complexes formed by preincubating 200 nM SNAP-647-APC-C, 200 nM SNAP-549-mDia1-C, 8 μM latB-OG-actin and then diluting 200-fold prior to surface adsorption. Field of view (top) and time-lapse record of a single spot containing all three proteins (bottom). (F) Fraction of APC/mDia1 spots that contain detectable OG-actin in presence or absence of profilin (see Supplement).
Figure 3
Figure 3. Single molecule visualization of APC-C and mDia1-C collaborating to assemble actin filaments
(A) Triple-color TIRFM of the assembly of 1 μM OG-actin (green) in the presence of 50 pM SNAP-549-mDia1-C (red), 5 nM SNAP-647-APC-C (blue), 1 nM CapZ and 5 μM profilin. Asterisks indicates APC/mDia1/actin nucleation complex. Images (left; time in seconds) and corresponding profiles of fluorescence intensity along the length of the filament (right). Arrowheads mark barbed end (green), mDia1 (red), and APC (blue). (B) (Left) Density of formin-elongated filaments per 100 × 100 μm area for reactions containing 80 pM SNAP-549-mDia1-C, 1 nM CapZ, variable concentrations of SNAP-APC-C, ± 5 μM profilin. Error bars represent SD, N=3. (Right) APC-C dependent fold increase in density of formin-elongated filaments in the presence (black) and absence (grey) of profilin. (C) Same as in B, except using non-SNAP-tagged mDia1-C and tail-less mDia1 FH1FH2. (D) Western blot (anti-6His antibody) showing levels of mDia1-C and mDia1 FH1FH2 (both tagged with 6His) in supernatants after depletion by GST- (control) or GST-APC-C beads. Error bars represent SD, N=2. (E) Proposed ‘rocket launcher’ model for mDia1-APC collaboration during actin filament assembly (details in text).

References

    1. Pollard TD, Cooper JA. Actin, a central player in cell shape and movemente. Science. 2009 Nov 27;326:1208. - PMC - PubMed
    1. Chesarone MA, Goode BL. Actin nucleation and elongation factors: mechanisms and interplay. Curr Opin Cell Biol. 2009 Feb;21:28. - PMC - PubMed
    1. Campellone KG, Welch MD. A nucleator arms race: cellular control of actin assembly. Nat Rev Mol Cell Biol. 2010 Apr;11:237. - PMC - PubMed
    1. Quinlan ME, Hilgert S, Bedrossian A, Mullins RD, Kerkhoff E. Regulatory interactions between two actin nucleators, Spire and Cappuccino. J Cell Biol. 2007 Oct 8;179:117. - PMC - PubMed
    1. Graziano BR, et al. Mechanism and cellular function of Bud6 as an actin nucleation-promoting factor. Mol Biol Cell. 2011 Aug 31; - PMC - PubMed

Publication types

MeSH terms