. 2012;8(5):e1002650.
doi: 10.1371/journal.pgen.1002650. Epub 2012 May 24.

Twist1 suppresses senescence programs and thereby accelerates and maintains mutant Kras-induced lung tumorigenesis

Affiliations

Twist1 suppresses senescence programs and thereby accelerates and maintains mutant Kras-induced lung tumorigenesis

Phuoc T Tran et al. PLoS Genet. 2012.

Abstract

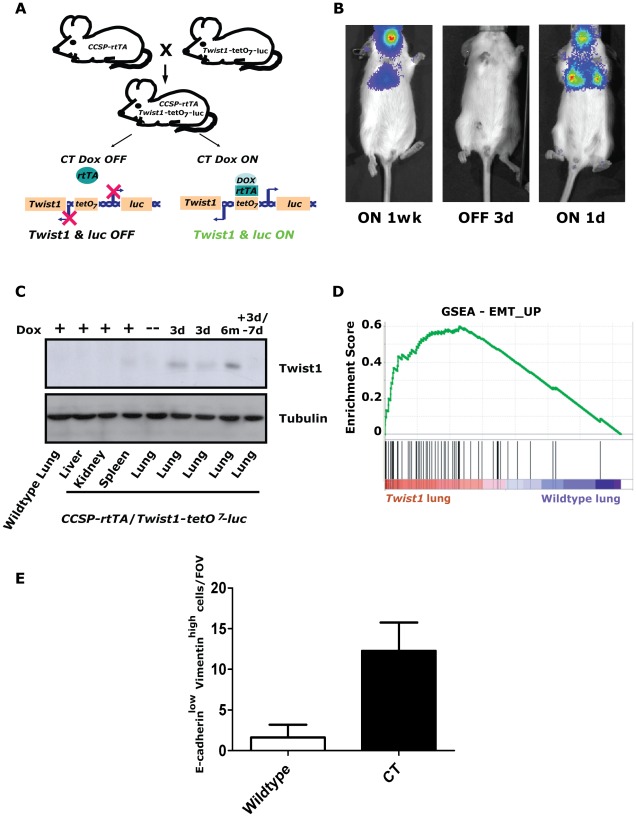
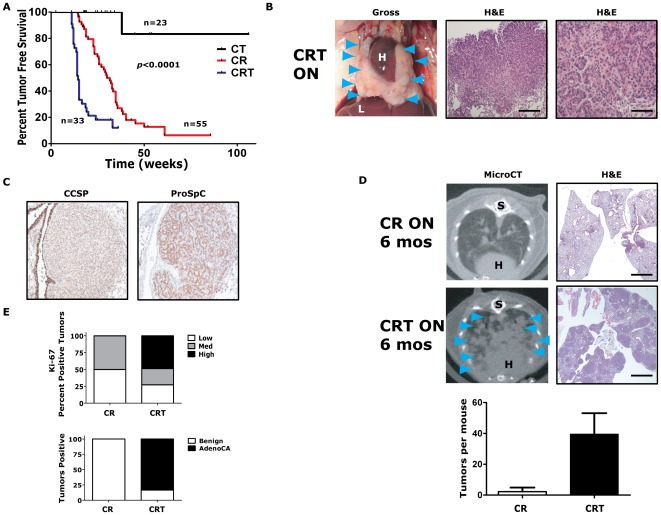
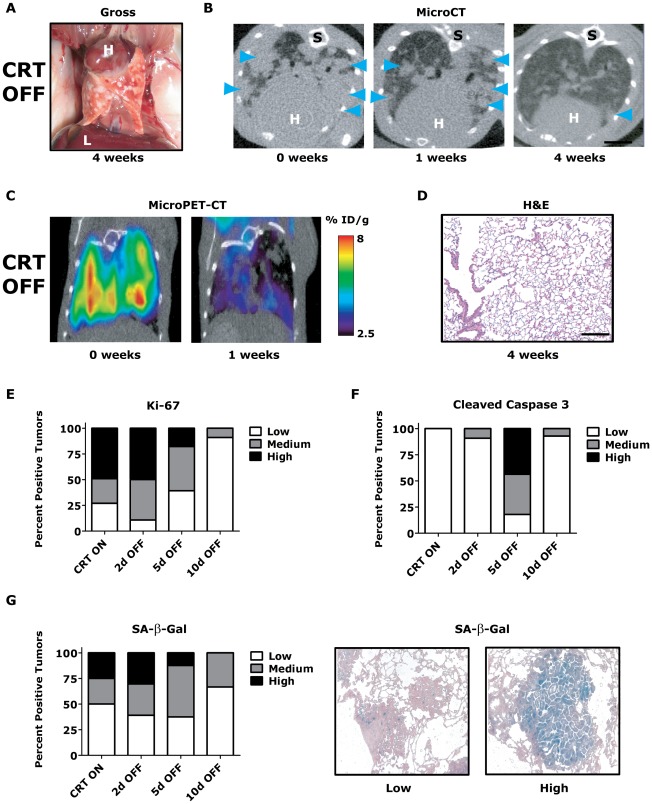
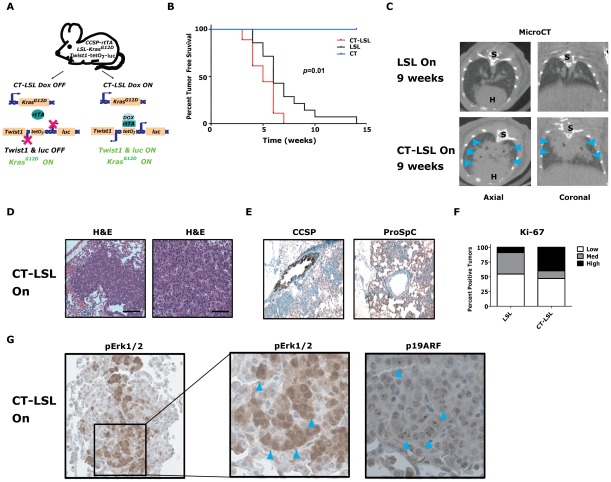
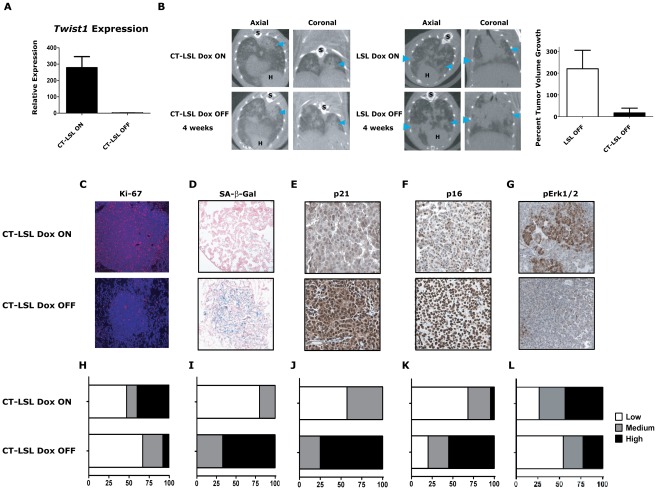
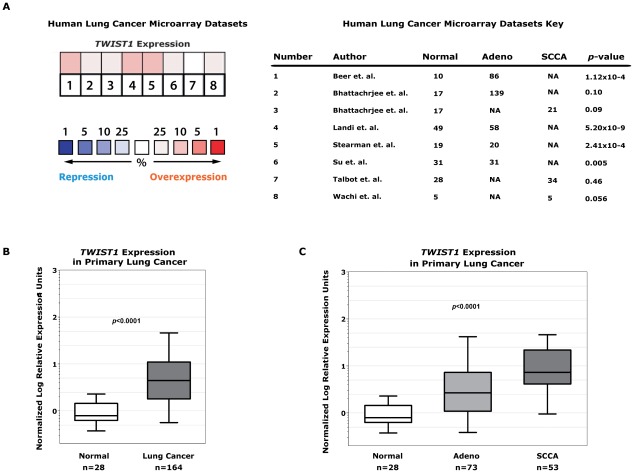
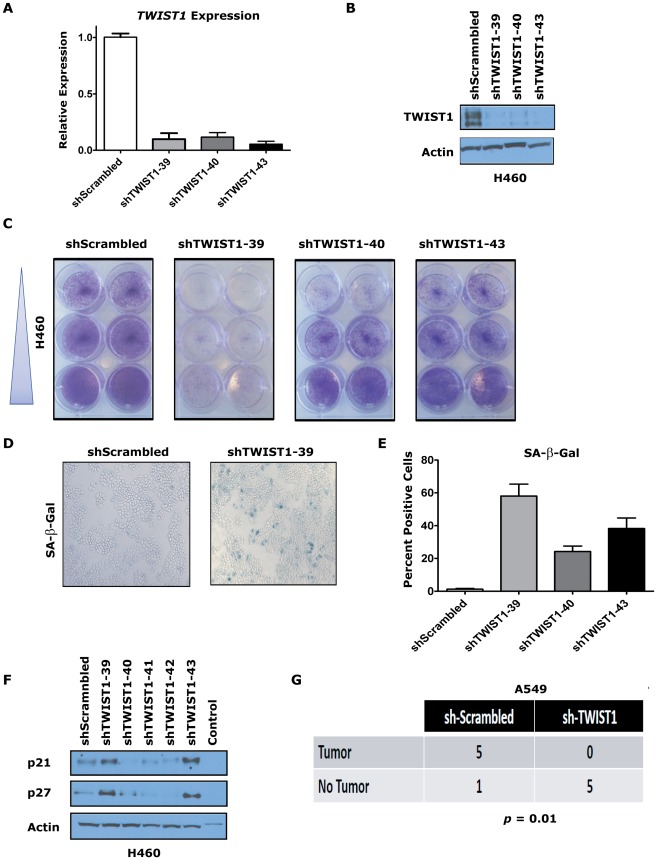
KRAS mutant lung cancers are generally refractory to chemotherapy as well targeted agents. To date, the identification of drugs to therapeutically inhibit K-RAS have been unsuccessful, suggesting that other approaches are required. We demonstrate in both a novel transgenic mutant Kras lung cancer mouse model and in human lung tumors that the inhibition of Twist1 restores a senescence program inducing the loss of a neoplastic phenotype. The Twist1 gene encodes for a transcription factor that is essential during embryogenesis. Twist1 has been suggested to play an important role during tumor progression. However, there is no in vivo evidence that Twist1 plays a role in autochthonous tumorigenesis. Through two novel transgenic mouse models, we show that Twist1 cooperates with Kras(G12D) to markedly accelerate lung tumorigenesis by abrogating cellular senescence programs and promoting the progression from benign adenomas to adenocarcinomas. Moreover, the suppression of Twist1 to physiological levels is sufficient to cause Kras mutant lung tumors to undergo senescence and lose their neoplastic features. Finally, we analyzed more than 500 human tumors to demonstrate that TWIST1 is frequently overexpressed in primary human lung tumors. The suppression of TWIST1 in human lung cancer cells also induced cellular senescence. Hence, TWIST1 is a critical regulator of cellular senescence programs, and the suppression of TWIST1 in human tumors may be an effective example of pro-senescence therapy.


Conflict of interest statement

The authors have declared that no competing interests exist.

Figures

Figure 1
Figure 1. Inducible Twist1 lung model of epithelial mesenchymal transition (EMT).
(A) A mouse line containing the Clara cell secretory protein (CCSP) promoter driving the reverse tetracycline transactivating protein (rtTA) is crossed with a line containing Twist1 and Luc under the control of bi-directional tetracycline-responsive elements (tetO7). In the bitransgenic animal, CCSP-rtTA/Twist1-tetO7-luc (CT), absence of doxycycline prevents rtTA protein from binding and activating the tetO operon. Addition of doxycycline (Dox) triggers a conformational change which enables tetO7 binding, activation and Twist1 and luc transcription. CT animals express Twist1 and luciferase inducibly in the lungs and trachea of bitransgenic mice as shown by (B) bioluminescence imaging (BLI) on a Xenogen Spectrum and (C) Western blotting for Twist1. BLI was performed on the same CT mouse with time “ON” or “OFF” Dox as indicated. (D) Enrichment plot of an EMT_UP signature following GSEA performed on lung mRNA samples taken from CT mouse lungs Dox ON (n = 2) and wildtype mouse lungs Dox ON (n = 2), NOM p-values, FDR q-values, and FWER p-values were all <0.001. (E) Plot of E-cadherinlow-Vimentinhigh cells per field of view immunofluorescence (IF) of the lungs from CT animals ON (n = 4) and wildtype (n = 4) animals; p<0.01 by Mann-Whitney t-test. d – day; wk – week; and m – month.
Figure 2
Figure 2. Twist1 accelerates KrasG12D-induced lung tumorigenesis and promotes progression to adenocarcinoma.
(A) Kaplan-Meier tumor free survival using serial microCT of CCSP-rtTA/Twist1-tetO7-luc (CT), CCSP-rtTA/tetO-KrasG12D (CR) and CCSP-rtTA/tetO-KrasG12D/Twist1-tetO7-luc (CRT) mice. The double inducible oncogene animals (CRT) developed multiple tumors at a median tumor latency that was significantly shorter than the single CR animals, 15 weeks, by log-rank analysis (p<0.0001). A syngenic control cohort consisting of wildtype mice, those with tetO-KrasG12D/Twist1-tetO7-luc (without CCSP-rtTA), CCSP-rtTA alone, or single oncogenes alone (n = 15 total) never developed lung tumors before 12 months of age. (B) Lung tumors from a CRT mouse at necropsy and H&E sections. Black bars equal 200 and 50 µm. H – heart; and L – liver. (C) Immunohistochemical (IHC) phenotyping of CRT tumors using antibodies against CCSP and proSpC. (D) Lung tumor burden is increased at 6 months in CRT versus CR mice qualitatively by microCT and H&E histology. Blue arrowheads denote lung tumors. (Lower panel) Lung tumors were quantified for CR versus CRT mice by microCT (n = 4 mice each). S – spine. Black bar equals 2 mm (E) Ki-67 IHC of CR versus CRT lung tumors (n = 3 mice each). Low - <5%; Med – 5–25%; and High - >25%. Histologic examination of lung tumors for numbers of benign lesions (hyperplasia, atypical adenomatous hyperplasia and adenomas) versus adenocarcinomas (AdenoCA) for CR and CRT mice (n = 2 mice each).
Figure 3
Figure 3. KrasG12D/Twist1-induced lung tumors regress following combined oncogene inactivation.
(A) Gross appearance of CRT lung tumors following 4 weeks of combined KrasG12D and Twist1 oncogene inactivation (n = 4). H – heart and L – liver. (B) Serial axial microCT of the same CRT mouse following 4 weeks of combined KrasG12D and Twist1 oncogene inactivation (n = 4) demonstrates tumor regression. Blue arrowheads denote lung tumors. S –spine. (C) Serial coronal FDG microPET-CT demonstrate decreased metabolic tumor burden after 1 week of combined KrasG12D and Twist1 oncogene inactivation (n = 2). (D) Normal appearing H&E histologic section from lung tumor moribund CTR OFF mouse following 4 weeks of combined KrasG12D and Twist1 oncogene inactivation (n = 4). Black bar equals 200 µm. CRT lung tumors demonstrate (E) decreased proliferation and (F) increased apoptosis following combined KrasG12D and Twist1 oncogene inactivation. CRT lung tumors were assayed for proliferation using Ki-67 IHC and quantified as in Figure 2E (n≥2 mice per time point). CRT lung tumors were assayed for levels of apoptosis using cleaved caspase 3 IHC and quantified (n≥2 mice per time point). Low - <1%; Med – 1–4%; and High - >4%. (G) Percentage of senescent lung tumors per mouse does not increase following combined KrasG12D and Twist1 oncogene inactivation. The level of senescence associated-beta-galactosidase (SA-β-Gal) correlates inversely with proliferative capacity of individual tumors. CRT lung tumors were assayed for levels of SA-β-Gal and quantified (n≥2 mice per time point). Low - <10%; Med – 10–30%; and High - >30%. Representative panels of tumors with “Low” and “High” SA-β-Gal staining.
Figure 4
Figure 4. Twist1 accelerates conditional KrasG12D-induced lung tumorigenesis.
(A) Crosses (CT×LSL) to produce CCSP-rtTA/Twist1-tetO7-luc/LSL-KrasG12D (CT-LSL) mice. CT-LSL mice are infected with intranasal Cre to activate KrasG12D. Addition of Dox enables Twist1 and luc transcription. In contrast to CRT OFF mice, CT-LSL OFF mice have KrasG12D still active and only Twist1 expression is inactivated. (B) Kaplan-Meier tumor free survival by serial microCT of F1 littermates with CT, LSL and CT-LSL genotypes. The double oncogene animals (CT-LSL, n = 18) developed multiple tumors at a median tumor latency that was significantly shorter than the single LSL (n = 14) animals, 5 versus 6 weeks (CT-LSL versus LSL, by log-rank analysis p = 0.0121). CT animals (n = 17) and littermate controls not infected with AdCMVCre (n = 5) never developed lung tumors. (C) Lung tumor burden is increased at 9 weeks post-AdCMVCre in CT-LSL versus LSL mice qualitatively by representative microCT. Blue arrowheads denote lung tumors. H – heart; and S – spine. (D) H&E stained sections of lung tumors from a CT-LSL mouse. Black bars equal 200 and 50 µm. (E) Immunohistochemical (IHC) phenotyping of CT-LSL lung tumors indicate a type II pneumocyte cell of origin using CCSP and proSp-C markers. (F) Ki-67 IHC of LSL versus CT-LSL lung tumors (n = 2). Low - <5%; Med – 5–25%; and High - >25%. (G) pErk1/2 and p19ARF IHC staining in serial sections demonstrate overlap. Note the nucleolar staining of p19ARF, specific nuclei are denoted by blue arrowheads.
Figure 5
Figure 5. Activation of Kras-induced senescence by down-regulation of Twist1 in autochthonous KrasG12D/Twist1-induced lung tumors.
(A) Verification by qPCR that Twist1 mRNA levels are reduced following doxycycline withdrawal in CT-LSL OFF (n = 4) compared to CT-LSL ON (n = 3) lung tumors. (B) CT-LSL OFF lung tumors are static following single Twist1 inactivation. Representative serial microCT of CT-LSL lung tumor moribund mouse just before, CT-LSL ON, and 4 weeks following doxycycline removal from the drinking water, CT-LSL OFF, resulting in de-induction of Twist1only (n = 13 tumors quantified from 4 mice). For comparison, LSL-KrasG12D (LSL) mouse lung tumors grow despite withdrawal of doxycycline, LSL OFF (n = 11 tumors quantified from 3 mice). Percent tumor volume growth was quantified and calculated showing CT-LSL OFF tumor stasis after 4 weeks compared to LSL OFF (p<0.0001). H – heart; and S – spine. CT-LSL OFF lung tumors demonstrate markers consistent with an increase in the number of senescent cells, such as (C) reduction in proliferation by Ki-67 IHC, (D) increased lung tumors positive for SA-β-gal staining, increased levels of (E) p21 and (F) p16 by IHC (n = 3 mice per staining). (G) pErk1/2 levels reduced moderately following Twist1 inactivation in CT-LSL OFF tumors. (H–L) Quantification of (C–G) as described in previous figures for Ki67 (see Figure 2) and SA-β-gal (see Figure 3) staining; and 21, p16 and pERk1/2 as follows - Low - <10%; Med – 10–25%; and High - >25%. All animals in these experiments were taken off doxycycline (“OFF”) continuously for 2–5 weeks and then sacrificed.
Figure 6
Figure 6. TWIST1 is overexpressed in human primary lung cancers.
(A) Human non-small cell lung cancer samples (n = 394) compared against normal lung (n = 159) from seven independent microarray datasets for TWIST1 expression using Oncomine. The heatmap contains individual studies (see accompanying legend; #2 and #3 are from the same dataset analyzed by adenocarcinoma and squamous cell carcinoma, respectively). The heat map intensity corresponds to percentile overexpression (red) or repression (blue). The median rank across all eight datasets demonstrates TWIST1 is overexpressed in human lung cancer, p = 0.04. (B) We validated this microarray analysis by performing qPCR on primary human tumor samples for TWIST1. TWIST1 mRNA is overexpressed in human lung cancer (n = 164) compared to normal lung (n = 28), p<0.0001 by Mann-Whitney t-test. (C) Analysis of data from (B) broken down by adenocarcinoma (Adeno, n = 73) and squamous cell carcinoma (SCCA, n = 53) histology, p<0.0001 using one-way ANOVA.
Figure 7
Figure 7. TWIST1 knockdown activates senescence in human non-small cell lung cancer cells.
Three different shRNAs were able to knockdown TWIST1 mRNA levels and result in decreased TWIST1 protein in the KRAS mutated non-small cell lung cancer (NSCLC) cell line H460 as shown by (A) qPCR and (B) TWIST1 Western blotting on day 9 after the shRNA infection. (C) Representative duplicates of crystal violet staining of serially diluted H460 NSCLC cells demonstrate TWIST1 knockdown decreases cellular proliferation. (D) Representative photomicrographs of increased SA-β-gal staining of cells following shRNA mediated TWIST1 knockdown using sh-TWIST1-39. (E) Quantification of SA-β-gal stained cells following shRNA mediated TWIST1 knockdown. (F) TWIST1 knockdown in H460 results in the upregulation of some additional markers of senescence, p21 and p27 as shown by Western blotting on day 9 after the shRNA infection. (G) A549 cells require TWIST1 overexpression to form subcutaneous tumors in NOD-SCID mice. A contingency table of A549 cells infected with sh-Scrambled control or sh-TWIST1 shRNA that were implanted into NOD-SCID mice and 4 weeks later scored for tumor development (5/6 versus 0/5, respectively, p = 0.01 by Fisher's exact test).

References

    1. Jemal A, Siegel R, Xu J, Ward E. Cancer statistics, 2010. CA Cancer J Clin. 2010;60:277–300. - PubMed
    1. Ding L, Getz G, Wheeler DA, Mardis ER, McLellan MD, et al. Somatic mutations affect key pathways in lung adenocarcinoma. Nature. 2008;455:1069–1075. - PMC - PubMed
    1. Fisher GH, Wellen SL, Klimstra D, Lenczowski JM, Tichelaar JW, et al. Induction and apoptotic regression of lung adenocarcinomas by regulation of a K-Ras transgene in the presence and absence of tumor suppressor genes. Genes Dev. 2001;15:3249–3262. - PMC - PubMed
    1. Ji H, Li D, Chen L, Shimamura T, Kobayashi S, et al. The impact of human EGFR kinase domain mutations on lung tumorigenesis and in vivo sensitivity to EGFR-targeted therapies. Cancer Cell. 2006;9:485–495. - PubMed
    1. Politi K, Zakowski MF, Fan PD, Schonfeld EA, Pao W, et al. Lung adenocarcinomas induced in mice by mutant EGF receptors found in human lung cancers respond to a tyrosine kinase inhibitor or to down-regulation of the receptors. Genes Dev. 2006;20:1496–1510. - PMC - PubMed

Publication types

MeSH terms