. 2012 May 25:3:101.
doi: 10.3389/fpls.2012.00101. eCollection 2012.

Evolution and expression of tandem duplicated maize flavonol synthase genes

Affiliations

Evolution and expression of tandem duplicated maize flavonol synthase genes

María Lorena Falcone Ferreyra et al. Front Plant Sci. .

Abstract

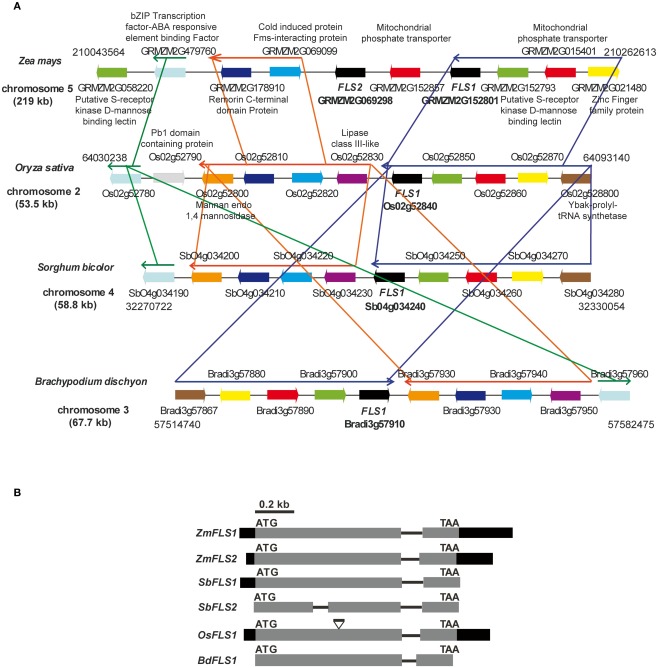
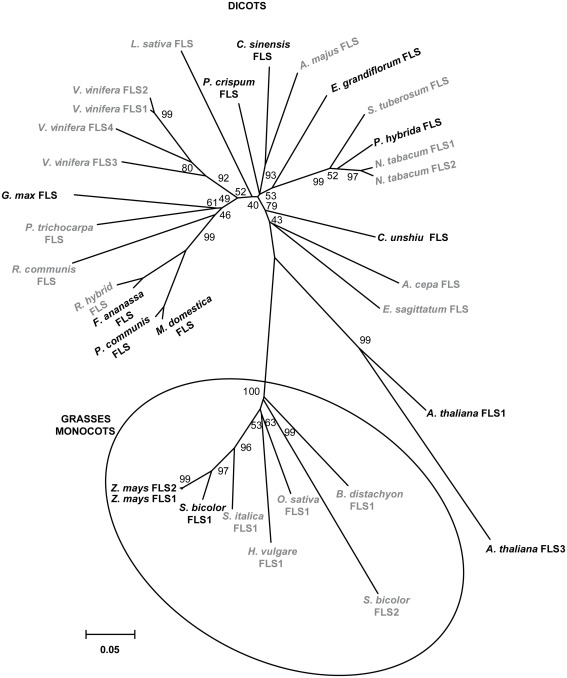
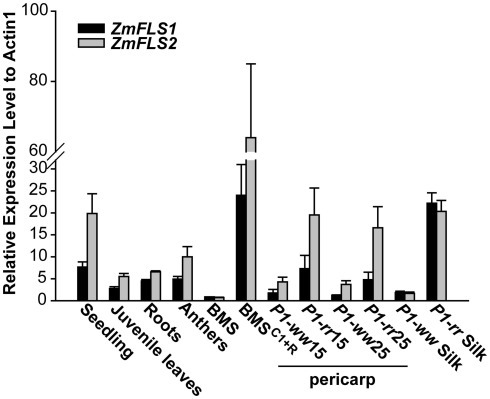
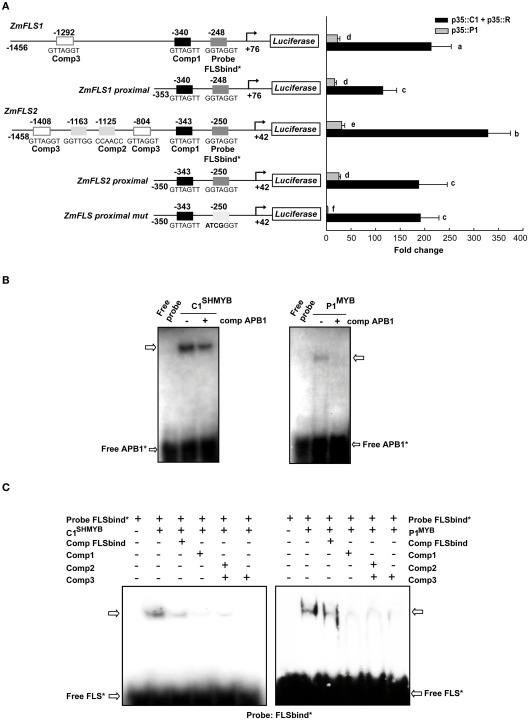
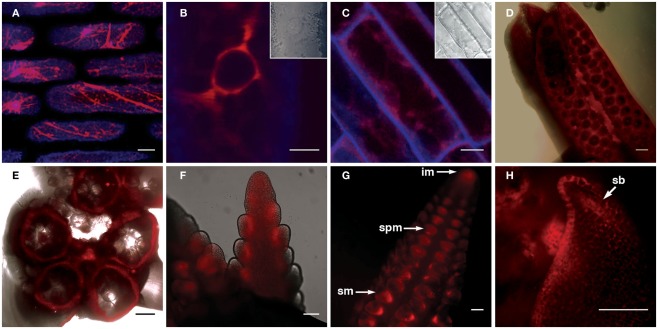
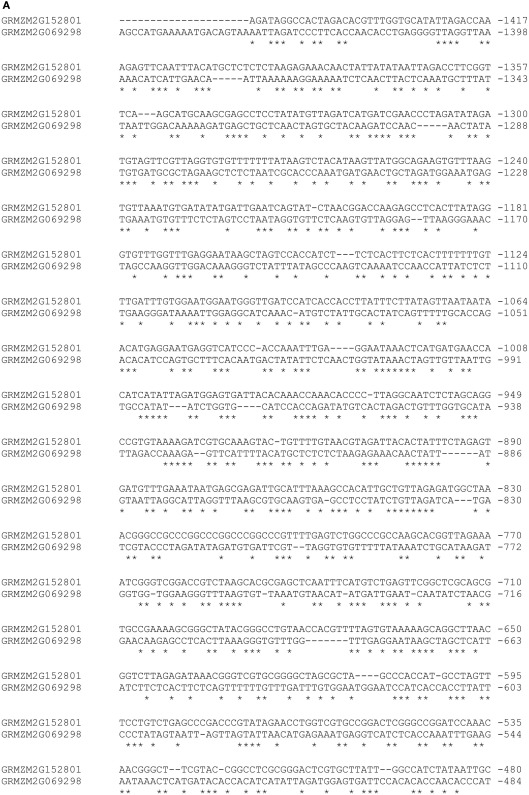
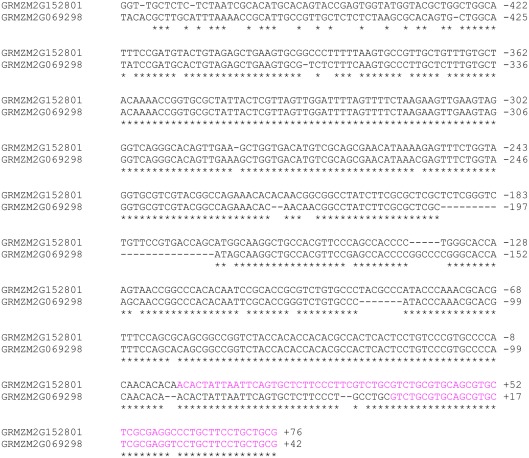
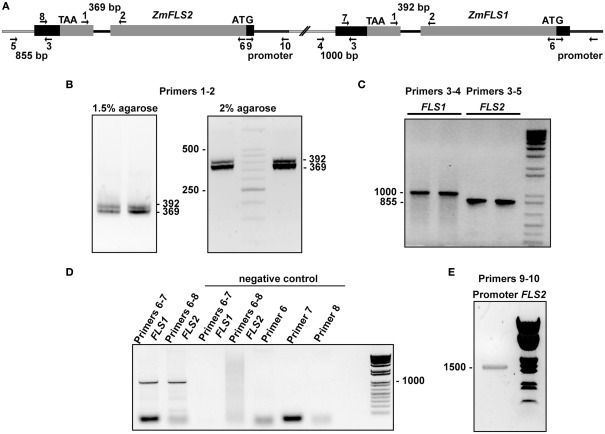
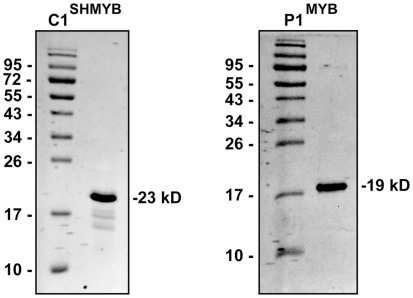
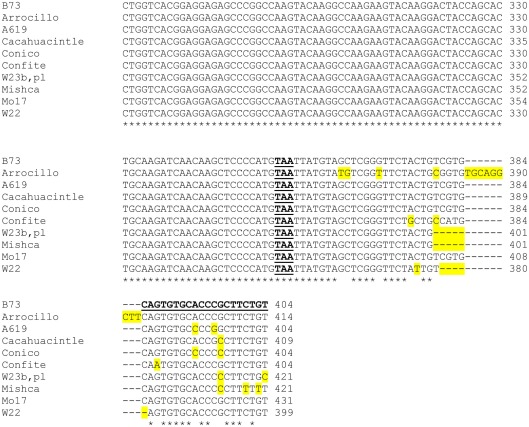
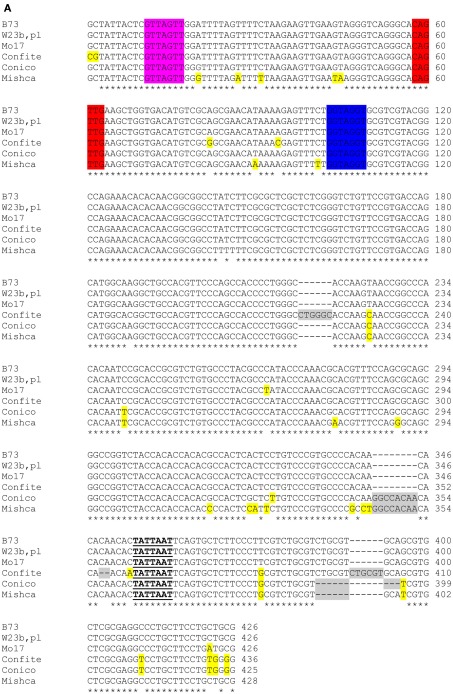
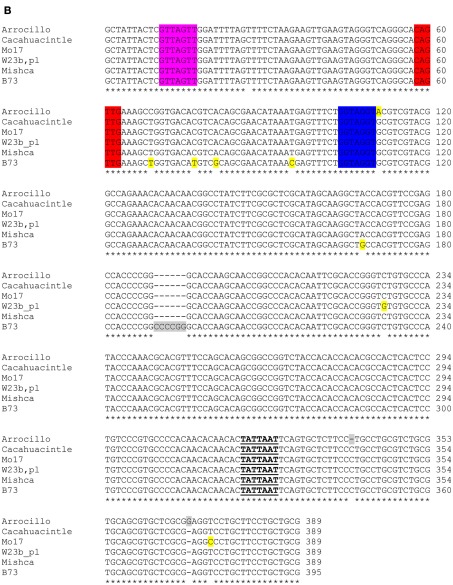
Flavonoids are specialized compounds widely distributed and with diverse functions throughout the plant kingdom and with several benefits for human health. In particular, flavonols, synthesized by flavonol synthase (FLS), protect plants against UV-B radiation and are essential for male fertility in maize and other plants. We have recently characterized a UV-B inducible ZmFLS1, corresponding to the first to be described in monocot plants. Interestingly, the new assembly of the B73 maize genome revealed the presence of a second putative FLS gene (ZmFLS2), with very high identity with ZmFLS1. ZmFLSs expression was analyzed in different maize tissues, and by combining electrophoretic mobility shift assays and transient expression experiments, we show that both genes are direct targets of anthocyanin (C1/PL1 + R/B) and 3-deoxy flavonoid (P1) transcriptional regulators. ZmFLS expression analyses show higher levels of both transcripts in high altitude landraces than inbred lines, and both genes are regulated by UV-B radiation in all lines analyzed. Moreover, the high sequence conservation of the ZmFLS promoters between maize lines suggests that the differences observed in ZmFLS expression are due to allelic variations in the transcription factors that regulate their activities. Finally, we generated pFLS1::FLS1-RFP transgenic plants and analyzed ZmFLS1 expression in different maize tissues; we found that this enzyme is localized in the ER and the perinuclear region.

Keywords: UV-B; duplication; grasses; maize; natural variation.


Figures

Figure 1
Figure 1
Regional synteny (A) and structure of FLS genes (B) from grasses. (A) Genomic arrangement of FLS and neighboring genes in Zea mays, Sorghum bicolor, Brachypodium distachyon, and Oryza sativa. The numbers on each side indicate the localization of the regions in the chromosomes, each gene in the different species is indicated with the same color. The length of chromosomes displayed is indicated in kb. Thin arrows above the genes indicate conserved regions between species. The graph was constructed using CoGe’s Genome Evolution Analysis tool (CoGe team software) at http://synteny.cnr.berkeley.edu/CoGe/GEvo.p. (B) Exons are represented by boxes, gray and black boxes indicate coding and UTR regions, respectively, and black lines represent non-coding regions. Start and stop codons are indicated.
Figure 2
Figure 2
Phylogeny of selected FLS proteins. The numbers indicate bootstrap values (10,000 replicates). Bar = 0.1 amino acid substitutions per site. FLSs from monocot grass plants are clustered in circles. Enzymes with demonstrated and predicted activities are indicated in black and gray, respectively.
Figure 3
Figure 3
Expression analysis of ZmFLS genes. ZmFLS expression evaluated by RT-qPCR in different tissues of the maize B73 inbred line: seedling (7-day-old plants), juvenile leaves (21-day-old plants), roots (21-day-old plants), and anthers; 15 and 25 days-old pericarps and silks expressing or not P1 gene and Black Mexican Sweet (BMS) maize cells ectopically expressing the C1 + R regulators [BMSC1+R] and untransformed controls (BMS). Each reaction was normalized using the Ct values corresponding to the actin1 mRNA (J01238). The means of the results obtained from biological triplicates are shown; the error bars indicate the SD of the samples.
Figure 4
Figure 4
Regulation of ZmFLS expression by P1 and C1 + R. (A) Transient expression following the co-transfection of maize protoplasts with p35S::P1 or p35S::C1 + p35S::R along with the constructs shown on the left. Putative p1/C1 binding sites are indicated with boxes and the sequences of the oligonucleotide probes used for DNA-binding experiments are shown below the boxes. For each construct analyzed and for each regulator, different letters indicate a significant difference at P < 0.05. (B) Binding of purified C1SHMYB and P1MYB proteins to 32P-labeled APB1 probe containing the haPBS of A1 promoter analyzed by electrophoretic mobility shift assays (EMSA; Hernandez et al., 2004). (C) Gel mobility retardation analyses with purified C1SHMYB and P1MYB proteins and FLSbind as probe. Free probe is indicated with an arrow.+ and − indicate the presence or absence of different competitors, respectively.
Figure 5
Figure 5
Transgenic expression of pZmFLS1::ZmFLS1-RFP. Confocal laser-scanning micrographs showing localization of ZmFLS1-RFP in maize leaf epidermal cells (A,B); root cells (C); anthers (D,E), tassel branch primordia (F), and ear primordia (G,H). FLS1-RFP was most easily detected in the ER (A) and perinuclear region (B) of cells. Red represents FLS1-RFP fluorescence, while blue represents cell wall autofluorescence. Brightfield images indicate the position of the nucleus and cell boundaries [(B–C) insets and (D–E) overlay]. Scale bars represent 5, 10, 20, 100 μm [(A–H), respectively]. White arrows indicate the inflorescence meristem (im), spikelet pair meristem (spm), spikelet meristem (sm), and suppressed bract (sb).
Figure 6
Figure 6
Regulation of ZmFLS expression by UV-B radiation. ZmFLS1 (A) and ZmFLS2 (B) transcript levels under control conditions in the absence of UV-B (no UV-B) and after an 8-h-UV-B-treatment (UV-B) analyzed by RT-qPCR. Adult leaf samples from maize inbred lines (A619, Mo17, W22, B73, and W23 with or without the dominant alleles for the B PL1 regulators) and from five maize landraces from high altitudes (Mishca, Conico, Confite, Cacahuacintle, and Arrocillo) were analyzed. (C) Induction of ZmFLS genes expression by UV-B radiation. Each reaction was normalized using the Ct values corresponding to the thioredoxin-like transcript (AW927774). The means of the results obtained from biological triplicates are shown; the error bars indicate the SD of the samples.
Figure A1
Figure A1
Alignment of ZmFLS promoters of B73 maize.
Figure A1
Figure A1
Alignment of ZmFLS promoters of B73 maize.
Figure A2
Figure A2
Two ZmFLS genes are present in the B73 maize line. (A) Organization of ZmFLS genes in the chromosome 5. Primers used for amplification are indicated by arrows, and the predicted PCR product size is shown with numbers above them. Amplification of ZmFLS introns (B), 3′UTR regions downstream of ZmFLS genes (C), ZmFLS1 and ZmFLS2 genes from the BAC clone (D), and ZmFLS2 promoter (1.5 kb upstream the start codon) (E).
Figure A3
Figure A3
SDS-PAGE analysis (15%) of the purified MYB domains of P1 and C1SH. The numbers on the sides of the gels indicate the molecular mass of standard proteins in kD.
Figure A4
Figure A4
Sequence comparison of partial ZmFLS1 (A) and ZmFLS2 (B) genes in different maize lines. The regions of ZmFLS1 and ZmFLS2 genes range from +740 bp (exon 1) to +1218 and +1143 bp, respectively (3′UTR). The introns in ZmFLS genes are highlighted in gray, different nucleotides and insertions or deletions are highlighted in yellow. Stop codons are indicated in bold-underlined letters. Primers used for RT-qPCR are in bold-underlined letters on B73 sequences.
Figure A4
Figure A4
Sequence comparison of partial ZmFLS1 (A) and ZmFLS2 (B) genes in different maize lines. The regions of ZmFLS1 and ZmFLS2 genes range from +740 bp (exon 1) to +1218 and +1143 bp, respectively (3′UTR). The introns in ZmFLS genes are highlighted in gray, different nucleotides and insertions or deletions are highlighted in yellow. Stop codons are indicated in bold-underlined letters. Primers used for RT-qPCR are in bold-underlined letters on B73 sequences.
Figure A5
Figure A5
Phylogenetic tree based on nucleotide sequences of ZmFLS1 and ZmFLS2 genes in maize inbred lines and landraces from high altitudes. The numbers indicate bootstrap values (10,000 replicates). Bar = 0.1 amino acid substitutions per site. OsFLS1 was defined as the out-group.
Figure A6
Figure A6
Alignment of ZmFLS1 (A) and ZmFLS2 (B) proximal promoters of maize inbred lines and landraces from high altitudes. C1/P1-binding sites are highlighted in different colors. Insertions or deletions in promoters are highlighted in gray, while differences in nucleotides from B73 are highlighted in yellow. The putative TATA boxes are indicated in bold-underlined letters.
Figure A6
Figure A6
Alignment of ZmFLS1 (A) and ZmFLS2 (B) proximal promoters of maize inbred lines and landraces from high altitudes. C1/P1-binding sites are highlighted in different colors. Insertions or deletions in promoters are highlighted in gray, while differences in nucleotides from B73 are highlighted in yellow. The putative TATA boxes are indicated in bold-underlined letters.

Similar articles

Cited by

References

    1. Bailey-Serres J., Dawe R. K. (1996). Both 5′ and 3′ sequences of maize adh7 mRNA are required for enhanced translation under low-oxygen conditions. Plant Physiol. 112, 685–69510.1104/pp.112.2.685 - DOI - PMC - PubMed
    1. Bradford M. M. (1976). A rapid and sensitive method for the quantitation of microgram quantities of protein utilizing the principle of protein-dye binding. Anal. Biochem. 72, 248–25410.1016/0003-2697(76)90527-3 - DOI - PubMed
    1. Branco-Price C., Kaiser K. A., Jang C. J., Larive C. K., Bailey-Serres J. (2008). Selective mRNA translation coordinates energetic and metabolic adjustments to cellular oxygen deprivation and reoxygenation in Arabidopsis thaliana. Plant J. 56, 743–75510.1111/j.1365-313X.2008.03642.x - DOI - PubMed
    1. Brown D. E., Rashotte A. M., Murphy A. S., Normanly J., Tague B. W., Peer W. A., Taiz L., Muday G. K. (2001). Flavonoids act as negative regulators of auxin transport in vivo in Arabidopsis. Plant Physiol. 126, 524–53510.1104/pp.126.2.524 - DOI - PMC - PubMed
    1. Bruggmann R., Bharti A. K., Gundlach H., Lai J., Young S., Pontaroli A. C., Wei F., Haberer G., Fuks G., Du C., Raymond C., Estep M. C., Liu R., Bennetzen J. L., Chan A. P., Rabinowicz P. D., Quackenbush J., Barbazuk W. B., Wing R. A., Birren B., Nusbaum C., Rounsley S., Mayer K. F., Messing J. (2006). Uneven chromosome contraction and expansion in the maize genome. Genome Res. 16, 1241–125110.1101/gr.5338906 - DOI - PMC - PubMed

LinkOut - more resources