. 2011 Jun;5(2):113-32.
doi: 10.1007/s11571-010-9142-9. Epub 2010 Dec 10.

Generalization of learning by synchronous waves: from perceptual organization to invariant organization

Generalization of learning by synchronous waves: from perceptual organization to invariant organization

David M Alexander et al. Cogn Neurodyn. 2011 Jun.

Abstract

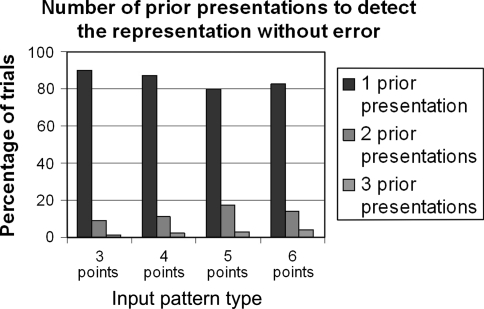
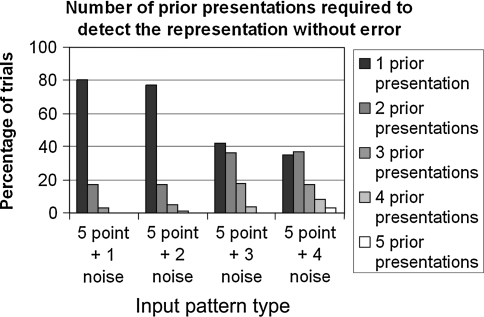
From a few presentations of an object, perceptual systems are able to extract invariant properties such that novel presentations are immediately recognized. This may be enabled by inferring the set of all representations equivalent under certain transformations. We implemented this principle in a neurodynamic model that stores activity patterns representing transformed versions of the same object in a distributed fashion within maps, such that translation across the map corresponds to the relevant transformation. When a pattern on the map is activated, this causes activity to spread out as a wave across the map, activating all the transformed versions represented. Computational studies illustrate the efficacy of the proposed mechanism. The model rapidly learns and successfully recognizes rotated and scaled versions of a visual representation from a few prior presentations. For topographical maps such as primary visual cortex, the mechanism simultaneously represents identity and variation of visual percepts whose features change through time.

Keywords: Cortical dynamics; Learning; Topographic maps; Visual cortex.


Figures

Fig. 1
Fig. 1
Sequential images (top to bottom) of a rectangle that transforms through time by rotating and changing size. Recognition of object constancy is achieved automatically and effortlessly by the visual system. The mechanism described in the present research is able to achieve this type of generalization from only a few examples. This process of generalization is indicated in the figure by the gray points forming the top-most rectangles, which become black by the fourth instance of the rectangle
Fig. 2
Fig. 2
Garner patterns comprising the set of all 90 five-dot patterns that can be constructed on an imaginary 3 × 3 grid leaving neither rows nor columns empty. They fall into 17 disjunctive Equivalence Sets (ES) of patterns that can be transformed into each other by rotations in 90° steps and/or by reflections. Seven ES contain eight patterns, eight sets contain four patterns, and two sets consist of only one pattern (see Fig. 2). Garner and Clement (1963) proposed that the size of the ES determines Goodness, in the sense that the smaller the Equivalent Set Size of a pattern (ESS), the larger its Goodness
Fig. 3
Fig. 3
Illustration of the complex-logarithmic mapping and its property of rotation invariance. Left of figure shows four triangles rotated about the origin. This rotation is denoted by the transformation f(z). Right of figure shows the complex-logarithmic mapping of the z-plane, M(z’), in which the four triangles are also represented. While the shape of each triangle is distorted, the four versions are all translations, Τ, of each other. Translating the objects vertically within the complex-logarithmic map is equivalent to rotating about the origin in the untransformed space. If a translated version of the triangle in M is mapped back into the original space via M−1, the result is a rotated version of the object. Likewise, translating horizontally in the complex-logarithmic map is equivalent to scaling (smaller/larger) about the origin in the untransformed space (see Schwartz 1980)
Fig. 4
Fig. 4
The principle of reinforcement of map translations of a representation by travelling waves. Upper The original input pattern is shown as a set of red points. A translation of the representation is shown as a set of blue points. Waves emanating from each point the red pattern reinforce the pattern of all cells that are activated in phase (circles). The blue pattern is thereby reinforced. Lower The mutual connections (black lines) reinforced between the points in original input pattern, and mutual connections reinforced in the arbitrary translation of the representation
Fig. 5
Fig. 5
Modeling of spatio-temporal waves on a hexagonal lattice of columns. Upper When an input pattern is presented to the lattice (red) a set of synchronous spatio-temporal waves (black lines) emerge—one wave centred on each of the pattern’s points. The radius of the wave increases with increasing time during the presentation. The peak in spatio-temporal wave is the relevant active state for the learning rule (ki = 1, blue) and points not at peak phase are inactive (ki = 0, green). Middle The same wave-activated points as upper figure, with black interconnection lines showing that the synchronously activated points (ki = 1, blue) form translations of the input pattern. All of the n(n − 1) interconnections between n points in each copy of the input pattern are synchronously activated by the travelling wave. Not all n(n − 1) connections are shown, for visualization purposes. Lower In addition, a large number of connections that are not within the set of n(n − 1) interconnections between n points in each copy of the input pattern are also synchronous activated. For example, all connections between different copies of the input pattern are also synchronously activated. Not all connections between different copies are shown, for visualization purposes
Fig. 6
Fig. 6
Test input patterns used in the modeling. Upper The four input patterns used to test the generalization mechanism in the small lattice. This lattice has 343 hypercolumns (73). The three point, four point, five point and six point input patterns are shown top-left, top-right, bottom-left and bottom-right, respectively. Lower The four input patterns used to test the generalization mechanism in the large lattice. This lattice has 2,401 columns (74). The three point, four point, five point and six point input patterns are shown top-left, top-right, bottom-left and bottom-right, respectively. These four input patterns are identical to their small lattice counterparts, except that they are spread over seven times the area. Since the large lattice also has seven times the area, the effect is to preserve the sizes of the input pattern relative to the size of lattice, while the lattice resolution is seven times greater. The geometric-algebraic transformation that scales the input pattern sevenfold also rotates them (see Sheridan et al. (2000) for details)
Fig. 7
Fig. 7
An example of a presentation sequence for the measurement of spurious activations, over three successive presentations. The input pattern is swept across the lattice from 2 o’clock to 8 o’clock (π/3 to 4π/3), with random jitter in position for each of the three placements. The extra noise element for each presentation is shown as a gray dot. Sweeps of the input pattern took place for each of 6 directions (0 to π, …, 5π/3 to 2π/3)
Fig. 8
Fig. 8
Histogram of weights for all connections in the network after 50 random presentations. The weights are expressed in units of ∆w. The 4 point input pattern was used on the small lattice (343 sites). The weight profile of connections outside the goal connection set, B(L)\C(R), shows an approximately exponential decline in numbers of connections as a function of weight. That is, at the 50th presentation, the numbers of connections in B(L)\C(R) with weight 4 ∆w was negligible compared to the number of connections in B(L)\C(R) with weight 0 or ∆w. The connections of the goal connection set, C(R), all had weights of 50 ∆w
Fig. 9
Fig. 9
Effects of input pattern size on B(L)\C(R) with non-zero weights, as a function of connection weight (expressed in units of ∆w). Each line in the graph shows the averaged results of 100 experiments in which input patterns were presented randomly to 50 different locations on the small (343 site) lattice. The number of connections in B(L)\C(R) of a given weight is represented as a proportion of the number of connections in C(R) to provide an index of signal to noise. The graph shows an average snapshot of the proportion of B(L)\C(R) of a given weight, as a function of input pattern size. The graph can also be interpreted in terms of the rate in which a particular subset of B(L)\C(R) with non-zero weights, once introduced into the network on a specific presentation, are then removed from the network upon successive presentations. The rate of removal of B(L)\C(R) with non-zero weights is slower for larger input patterns
Fig. 10
Fig. 10
Effects of input pattern size on B(L)\C(R) with non-zero weights, as a function of connection weight (expressed in units of ∆w). Each line in the graph shows the averaged results of 5 experiments in which input patterns were presented randomly to 50 different locations on the large (2,401 site) lattice. The number of connections in B(L)\C(R) of a given weight is represented as a proportion of the number of connections in C(R). The same overall pattern is found as for the smaller lattice, but the rate of decay of non-zero weights in B(L)\C(R) is much steeper (note change in scale of x-axis). The maximum number of successively reinforced B(L)\C(R) is also smaller in a large lattice, particularly for larger input patterns
Fig. 11
Fig. 11
Activation due to non-zero weights in B(L)\C(R), shown by activation measured at a random point added to each presentation. The gray line near y = 0 shows the activation at each successive presentation for the additional random point. The black diagonal line shows the activation level given in units of θp, as defined in Eq. 8. It can be seen that for most presentations, the additional random point was activated at a level below the activation threshold of θp = 1. This data was generated using the large lattice, using the three point input pattern
Fig. 12
Fig. 12
Number of prior presentations required to detect the representation without error. The data here are equivalent to Fig. 10, but shown in summary form for the 4 input pattern types. The histograms show the number of prior presentations that would be required to successfully detect the representations in the presence of the additional noise point. For example, setting the threshold θp = 1 results in correct detection of the representation 80–90% of the time, depending on input pattern size. Setting the threshold to θp = 3 results in correct detection of the representation 100% of the time. There is a slight degradation of performance with larger input pattern sizes. These data are from the large lattice, aggregated over 100 presentations per input pattern type
Fig. 13
Fig. 13
Number of prior presentations required to detect the representation without error in the presence of increasing noise. The conventions are the same as Fig. 11. The figure shows results for the 5 point input pattern with four levels of noise. This histograms show the number of prior presentations that were required to successfully detect the representation in the presence of each additional noise point. For example, setting the threshold θp = 1 results in correct detection of the representation 35–80% of the time, depending on the amount of additional noise. There is a degradation of performance with increasing noise levels. Setting the threshold to θp = 5 would result in correct detection of the representation 100% of the time at the maximum noise levels tested. These data are from the large lattice, aggregated over 100 presentations per input pattern type

References

    1. Abbott LF, Nelson SB (2000) Synaptic plasticity: taming the beast. Nat Neurosci 3 Suppl:1178–1183 - PubMed
    1. Adams DL, Horton JC. The representation of retinal blood vessels in primate striate cortex. J Neurosci. 2003;23(14):5984–5997. - PMC - PubMed
    1. Agu M. Field theory of pattern identification. Physics Review A. 1988;37(11):4415–4418. - PubMed
    1. Alexander DM, Leeuwen C. Mapping of contextual modulation in the population response of primary visual cortex. Cogn Neurodyn. 2010;4(1):1–24. - PMC - PubMed
    1. Alexander DM, Bourke PD, Sheridan P, Konstandatos O, Wright JJ. Intrinsic connections in tree shrew V1 imply a global to local mapping. Vis Res. 2004;44(9):857–876. - PubMed