Analysis of stability and bifurcations of fixed points and periodic solutions of a lumped model of neocortex with two delays
- PMID: 22655859
- PMCID: PMC3478171
- DOI: 10.1186/2190-8567-2-8
Analysis of stability and bifurcations of fixed points and periodic solutions of a lumped model of neocortex with two delays
Abstract
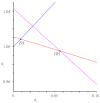
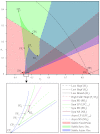
A lumped model of neural activity in neocortex is studied to identify regions of multi-stability of both steady states and periodic solutions. Presence of both steady states and periodic solutions is considered to correspond with epileptogenesis. The model, which consists of two delay differential equations with two fixed time lags is mainly studied for its dependency on varying connection strength between populations. Equilibria are identified, and using linear stability analysis, all transitions are determined under which both trivial and non-trivial fixed points lose stability. Periodic solutions arising at some of these bifurcations are numerically studied with a two-parameter bifurcation analysis.
Figures


Similar articles
-
Multiple bifurcations and coexistence in an inertial two-neuron system with multiple delays.Cogn Neurodyn. 2020 Jun;14(3):359-374. doi: 10.1007/s11571-020-09575-9. Epub 2020 Mar 6. Cogn Neurodyn. 2020. PMID: 32399077 Free PMC article.
-
Bifurcation structure of two coupled FHN neurons with delay.Math Biosci. 2015 Dec;270(Pt A):41-56. doi: 10.1016/j.mbs.2015.09.008. Epub 2015 Oct 20. Math Biosci. 2015. PMID: 26476143
-
The limits of sustained self-excitation and stable periodic pulse trains in the Yamada model with delayed optical feedback.Chaos. 2020 Sep;30(9):093101. doi: 10.1063/5.0007758. Chaos. 2020. PMID: 33003905
-
Hopf bifurcations in multiple-parameter space of the hodgkin-huxley equations II. Singularity theoretic approach and highly degenerate bifurcations.Biol Cybern. 2000 Mar;82(3):223-9. doi: 10.1007/s004220050022. Biol Cybern. 2000. PMID: 10664109
-
Bifurcation and control in a neural network with small and large delays.Neural Netw. 2013 Aug;44:132-42. doi: 10.1016/j.neunet.2013.03.016. Epub 2013 Mar 28. Neural Netw. 2013. PMID: 23597600
Cited by
-
Systems biology of complex symptom profiles: capturing interactivity across behavior, brain and immune regulation.Brain Behav Immun. 2013 Mar;29:1-8. doi: 10.1016/j.bbi.2012.09.008. Epub 2012 Sep 28. Brain Behav Immun. 2013. PMID: 23022717 Free PMC article. Review.
-
Bifurcation Analysis of a Micro-Machined Gyroscope with Nonlinear Stiffness and Electrostatic Forces.Micromachines (Basel). 2021 Jan 22;12(2):107. doi: 10.3390/mi12020107. Micromachines (Basel). 2021. PMID: 33499068 Free PMC article.
-
Emergence of metastable state dynamics in interconnected cortical networks with propagation delays.PLoS Comput Biol. 2013 Oct;9(10):e1003304. doi: 10.1371/journal.pcbi.1003304. Epub 2013 Oct 24. PLoS Comput Biol. 2013. PMID: 24204238 Free PMC article.
References
LinkOut - more resources
Full Text Sources

