Akt (protein kinase B) isoform phosphorylation and signaling downstream of mTOR (mammalian target of rapamycin) in denervated atrophic and hypertrophic mouse skeletal muscle
- PMID: 22657251
- PMCID: PMC3406959
- DOI: 10.1186/1750-2187-7-7
Akt (protein kinase B) isoform phosphorylation and signaling downstream of mTOR (mammalian target of rapamycin) in denervated atrophic and hypertrophic mouse skeletal muscle
Abstract
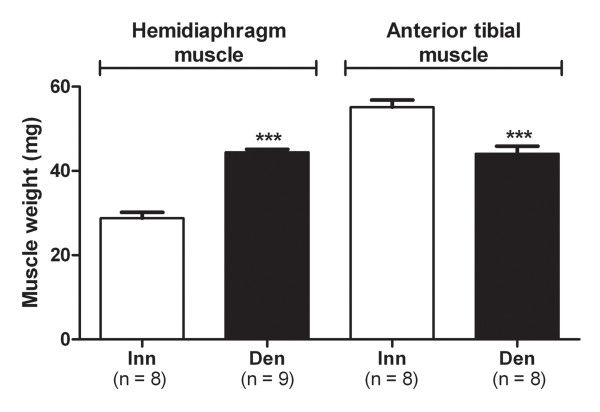
Background: The present study examines the hypothesis that Akt (protein kinase B)/mTOR (mammalian target of rapamycin) signaling is increased in hypertrophic and decreased in atrophic denervated muscle. Protein expression and phosphorylation of Akt1, Akt2, glycogen synthase kinase-3beta (GSK-3beta), eukaryotic initiation factor 4E binding protein 1 (4EBP1), 70 kD ribosomal protein S6 kinase (p70S6K1) and ribosomal protein S6 (rpS6) were examined in six-days denervated mouse anterior tibial (atrophic) and hemidiaphragm (hypertrophic) muscles.
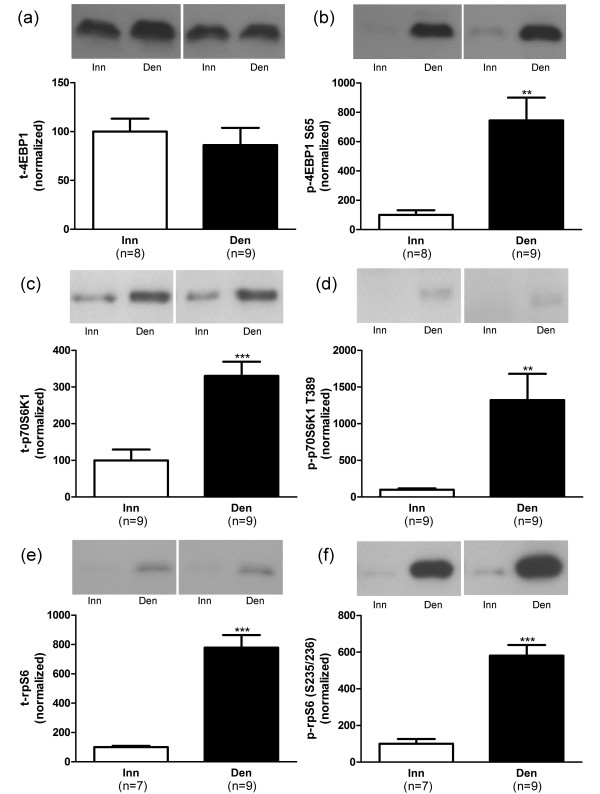
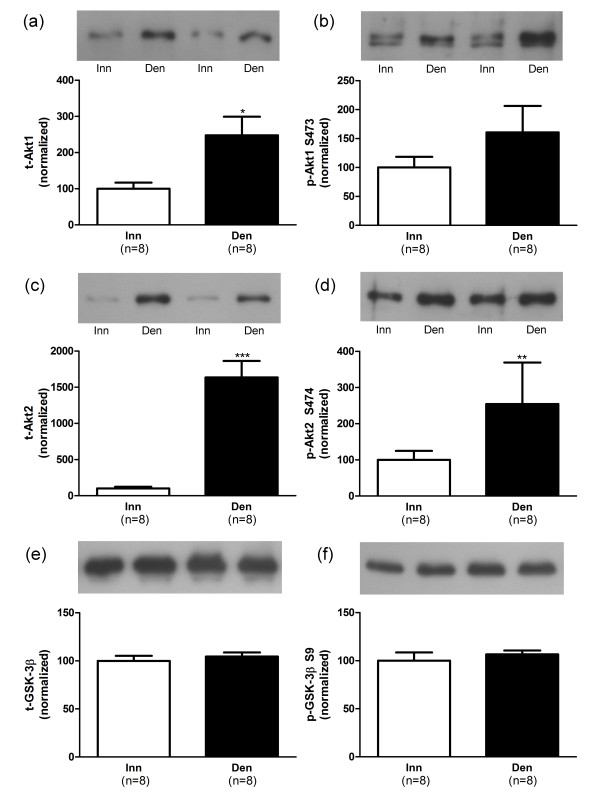
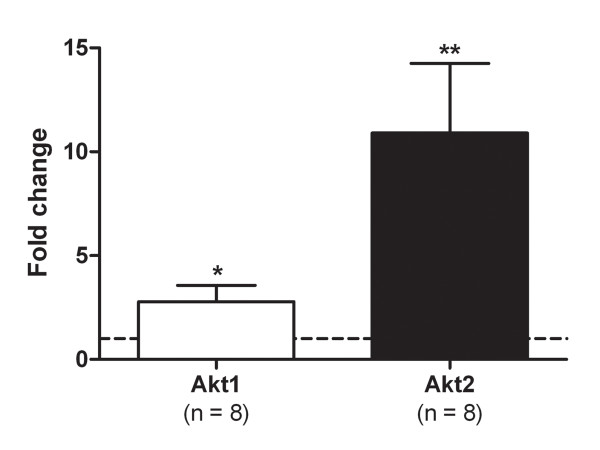
Results: In denervated hypertrophic muscle expression of total Akt1, Akt2, GSK-3beta, p70S6K1 and rpS6 proteins increased 2-10 fold whereas total 4EBP1 protein remained unaltered. In denervated atrophic muscle Akt1 and Akt2 total protein increased 2-16 fold. A small increase in expression of total rpS6 protein was also observed with no apparent changes in levels of total GSK-3beta, 4EBP1 or p70S6K1 proteins. The level of phosphorylated proteins increased 3-13 fold for all the proteins in hypertrophic denervated muscle. No significant changes in phosphorylated Akt1 or GSK-3beta were detected in atrophic denervated muscle. The phosphorylation levels of Akt2, 4EBP1, p70S6K1 and rpS6 were increased 2-18 fold in atrophic denervated muscle.
Conclusions: The results are consistent with increased Akt/mTOR signaling in hypertrophic skeletal muscle. Decreased levels of phosphorylated Akt (S473/S474) were not observed in denervated atrophic muscle and results downstream of mTOR indicate increased protein synthesis in denervated atrophic anterior tibial muscle as well as in denervated hypertrophic hemidiaphragm muscle. Increased protein degradation, rather than decreased protein synthesis, is likely to be responsible for the loss of muscle mass in denervated atrophic muscles.
Figures


Similar articles
-
Forkhead box O1 and muscle RING finger 1 protein expression in atrophic and hypertrophic denervated mouse skeletal muscle.J Mol Signal. 2014 Sep 24;9:9. doi: 10.1186/1750-2187-9-9. eCollection 2014. J Mol Signal. 2014. PMID: 25276226 Free PMC article.
-
p38 mitogen-activated protein kinase and mitogen-activated protein kinase-activated protein kinase 2 (MK2) signaling in atrophic and hypertrophic denervated mouse skeletal muscle.J Mol Signal. 2014 Mar 15;9(1):2. doi: 10.1186/1750-2187-9-2. J Mol Signal. 2014. PMID: 24629011 Free PMC article.
-
Expression and phosphorylation of eukaryotic translation initiation factor 4-gamma (eIF4G) in denervated atrophic and hypertrophic mouse skeletal muscle.Cell Biol Int. 2015 Apr;39(4):496-501. doi: 10.1002/cbin.10402. Epub 2015 Jan 26. Cell Biol Int. 2015. PMID: 25623635
-
GSK-3 directly regulates phospho-4EBP1 in renal cell carcinoma cell-line: an intrinsic subcellular mechanism for resistance to mTORC1 inhibition.BMC Cancer. 2016 Jul 7;16:393. doi: 10.1186/s12885-016-2418-7. BMC Cancer. 2016. PMID: 27387559 Free PMC article.
-
Resistance exercise decreases eIF2Bepsilon phosphorylation and potentiates the feeding-induced stimulation of p70S6K1 and rpS6 in young men.Am J Physiol Regul Integr Comp Physiol. 2008 Aug;295(2):R604-10. doi: 10.1152/ajpregu.00097.2008. Epub 2008 Jun 18. Am J Physiol Regul Integr Comp Physiol. 2008. PMID: 18565837
Cited by
-
A Novel Role of Numb as A Regulator of Pro-inflammatory Cytokine Production in Macrophages in Response to Toll-like Receptor 4.Sci Rep. 2015 Aug 5;5:12784. doi: 10.1038/srep12784. Sci Rep. 2015. PMID: 26244698 Free PMC article.
-
Titin-based mechanosensing modulates muscle hypertrophy.J Cachexia Sarcopenia Muscle. 2018 Oct;9(5):947-961. doi: 10.1002/jcsm.12319. Epub 2018 Jul 5. J Cachexia Sarcopenia Muscle. 2018. PMID: 29978560 Free PMC article.
-
Voluntary resistance wheel exercise from mid-life prevents sarcopenia and increases markers of mitochondrial function and autophagy in muscles of old male and female C57BL/6J mice.Skelet Muscle. 2016 Dec 13;6(1):45. doi: 10.1186/s13395-016-0117-3. Skelet Muscle. 2016. PMID: 27964759 Free PMC article.
-
Urinary bladder organ hypertrophy is partially regulated by Akt1-mediated protein synthesis pathway.Life Sci. 2018 May 15;201:63-71. doi: 10.1016/j.lfs.2018.03.041. Epub 2018 Mar 21. Life Sci. 2018. PMID: 29572181 Free PMC article.
-
The effects of heat stress on morphological properties and intracellular signaling of denervated and intact soleus muscles in rats.Physiol Rep. 2017 Aug;5(15):e13350. doi: 10.14814/phy2.13350. Physiol Rep. 2017. PMID: 28784851 Free PMC article.
References
-
- Bodine SC, Stitt TN, Gonzalez M, Kline WO, Stover GL, Bauerlein R, Zlotchenko E, Scrimgeour A, Lawrence JC, Glass DJ, Yancopoulos GD. Akt/mTOR pathway is a crucial regulator of skeletal muscle hypertrophy and can prevent muscle atrophy in vivo. Nat Cell Biol. 2001;3:1014–1019. doi: 10.1038/ncb1101-1014. - DOI - PubMed
-
- Peng XD, Xu PZ, Chen ML, Hahn-Windgassen A, Skeen J, Jacobs J, Sundararajan D, Chen WS, Crawford SE, Coleman KG, Hay N. Dwarfism, impaired skin development, skeletal muscle atrophy, delayed bone development, and impeded adipogenesis in mice lacking Akt1 and Akt2. Genes Dev. 2003;17:1352–1365. doi: 10.1101/gad.1089403. - DOI - PMC - PubMed
LinkOut - more resources
Full Text Sources
Molecular Biology Databases
Research Materials
Miscellaneous