Review
. 2012 Jun;9(2):125-58.
doi: 10.1016/j.plrev.2012.05.010. Epub 2012 May 18.

Nanopores: A journey towards DNA sequencing

Affiliations
Review

Nanopores: A journey towards DNA sequencing

Meni Wanunu. Phys Life Rev. 2012 Jun.

Abstract

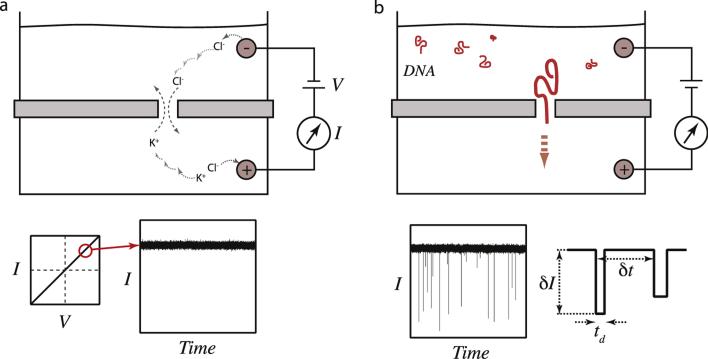
Much more than ever, nucleic acids are recognized as key building blocks in many of life's processes, and the science of studying these molecular wonders at the single-molecule level is thriving. A new method of doing so has been introduced in the mid 1990's. This method is exceedingly simple: a nanoscale pore that spans across an impermeable thin membrane is placed between two chambers that contain an electrolyte, and voltage is applied across the membrane using two electrodes. These conditions lead to a steady stream of ion flow across the pore. Nucleic acid molecules in solution can be driven through the pore, and structural features of the biomolecules are observed as measurable changes in the trans-membrane ion current. In essence, a nanopore is a high-throughput ion microscope and a single-molecule force apparatus. Nanopores are taking center stage as a tool that promises to read a DNA sequence, and this promise has resulted in overwhelming academic, industrial, and national interest. Regardless of the fate of future nanopore applications, in the process of this 16-year-long exploration, many studies have validated the indispensability of nanopores in the toolkit of single-molecule biophysics. This review surveys past and current studies related to nucleic acid biophysics, and will hopefully provoke a discussion of immediate and future prospects for the field.


Figures

Fig. 1
Fig. 1. Some examples of biological and synthetic nanopores
(a) The toxin α-hemolysin secreted by Staphylococcus aureus [15]. (b) MspA from Mycobacterium smegmatis [16]. (c) Engineered phi29 viral packaging motor [17]. (d) Ion-sculpted pores in silicon nitride membrane [18]. (e) Sub-10 nm thick solid-state pores generated by dry etching a selected area of a silicon nitride membrane and electron-beam pore drilling [20]. (f) Pores in a suspended single-layer graphene membrane [21]. Images were obtained with permission from the publishers.
Fig. 2
Fig. 2. The basics of nanopore measurements
(a) Application of voltage across a pore triggers electrochemical half-reactions leading to ion migration towards the membrane. Transport of the ions across the pore leads to electric current that is measured using a high-bandwidth electrometer. Typically the current–voltage response of a symmetric pore is linear, and holding the voltage at a constant voltage results in a steady-state DC current signal. (b) When charged biopolymers are added to the chamber, such as DNA molecules, biopolymer molecules diffuse towards the pore and stochastically enter it, producing a measurable “resistive pulse”. First-order parameters that can help in characterizing a sample are the dwell time (td), the average event amplitude (δI), and the time between successive events (δt).
Fig. 3
Fig. 3. Noise in nanopores
Current noise power spectra for a 4 nm diameter silicon nitride nanopore under no bias (red) and 300 mV bias (blue), measured in 1 M KCl with a custom high-bandwidth voltage-clamp amplifier. The signal was digitized at 4 MS/s, and the noise spectrum was estimated using Welch's method from three seconds of continuous data. (Courtesy of Jacob Rosenstein, Columbia University.) (For interpretation of the references to color in this figure, the reader is referred to the web version of this article.)
Fig. 4
Fig. 4. Signal in nanopores
(a) Current–voltage curves for a 10.2 nm diameter, 34 nm length silicon oxide pore in various KCl concentrations [33]. (b) Conductance (G) values for various 10 nm diameter pores in indicated KCl concentrations [33]. (c) Conductance (G) of various diameter nanopores in 50 nm thick silicon nitride membranes at 1 M KCl and 0.2 M KCl [34]. Solid lines are best fits to the data. (d) Experimental conductivities of different diameter graphene nanopores measured in a 1 M KCl solution [21]. (For interpretation of the references to color in this figure, the reader is referred to the web version of this article.)
Fig. 5
Fig. 5. Viscosity effects on current through α-hemolysin channels
(a) Experimental current values for an α-hemolysin channel as a function of temperature in the range 2–50 °C (1 M KCl, 120 mV applied voltage) [38]. (b) Log–log plot of the conductance of an α-hemolysin channel as a function of the solution viscosity, controlled by the addition of glycerol to the electrolyte solution (measured for 1 M KCl solutions at 120 mV voltage, 24 °C) [39]. Images obtained with permissions from the publishers.
Fig. 6
Fig. 6. Geometric resolution of a pore
(a) Resistive pulses that show ssDNA transport through an α-hemolysin channel [40]. The mean residual current for different ssDNA fragments (Ip) is constant for ssDNA with a contour length corresponding to N > 12 bases, consistent with the length of the channel's stem (see white ladder representing the 12 nucleotides). (b) Transport of dsDNA through nanopores fabricated in precision-thinned silicon nitride membranes [20]. Figure shows concatenated events during the transport of 3 kbp dsDNA for similar diameter pores fabricated in progressively thinner membranes, which resulted in increased baseline pore currents and increased pulse amplitudes (V = 300 mV). Images obtained with permissions from the publishers.
Fig. 7
Fig. 7. DNA capture into a pore
(a) Capture rate for 2.6 μM (circles) and 0.9 μM (squares) dC40 DNA into α-hemolysin as a function of voltage, measured at 2 °C. Inset shows distributions of the wait time (δt) between successive events for (dA)20 at 2.3 μM (squares); (dCdCdTdCdC)6 at 1.8 μM (triangles); (dC)40 at 0.5 μM (circles) [41]. (b) Capture rate of an end-biotinylated poly(dC)30 as a function of voltage when the nucleotide is introduced to the cis or trans chamber of an α-hemolysin channel [44]. (c) Capture rate as a function of voltage for λ-DNA into a 15 nm diameter solid-state nanopore as a function of voltage [45]. Inset shows a TEM image of the nanopore used in this study. (d) Semi-log plot of the capture rate of (i) 400 bp dsDNA, (ii) 3500 bp DNA, (iii) 48.5 kbp λ-DNA into a 4 nm diameter silicon nitride pore (inset shows linear plot) [42]. Images obtained with permissions from the publishers.
Fig. 8
Fig. 8. Pulse duration distributions for various nucleic acid/pore combinations
(a) Distribution for polyU210 ssRNA through an α-hemolysin pore shows 3 distinct populations, which were attributed to nucleic acid/pore collisions (1) and translocations with either of two entry orientations (2 + 3) [50]. (b) Distributions for poly(dA) and poly(dC) ssDNA homopolymers through α-hemolysin, which exhibit different mean timescales (tP) and tail shapes due to different interactions with the pore [51]. (c) Distributions for linear λ-DNA dsDNA through a 10 nm SiO2 pore reveal a very fast population in the first bin at < 0.1 ms and a tailing distribution that peaks at 2 ms [47]. (d) Distributions (semi-log) for 2 kbp linear dsDNA through a 4 nm silicon nitride pore, showing distinct fast and slow populations that were attributed to presence of interactions with the pore and the membrane [52]. Images obtained with permissions from the publishers.
Fig. 9
Fig. 9. Various scaling exponents with length for DNA translocation through nanopores
(a) Mean velocity of poly(dA)N translocation through α-hemolysin is constant for N > 12 (recorded at 2 °C and 120 mV) [51]. Inset shows a typical, asymmetric dwell-time distribution. (b) Mean dwell time vs. DNA length for dsDNA through a 10 nm SiO2 pore (recorded at 21 °C and 120 mV) [47,55]. Inset shows log-normal distributions for different DNA lengths. (c) Mean dwell time vs. DNA length for dsDNA through a 4 nm diameter pore (recorded at 21 °C and 300 mV) [52]. Cartoons illustrate the possible interactions that lead to the transition from t1- to t2-dominated dynamics. Images obtained with permissions from the publishers.
Fig. 10
Fig. 10. Nucleic acid entry orientation matters
(a) In pioneering experiments, Kasianowicz et al. passed poly(U) RNA homopolymers through an α-hemolysin channel. Based on the three distinct signal amplitude distributions, they hypothesized that events 1–3 corresponded to RNA collisions, passage of RNA in one orientation, and passage of RNA in another orientation, respectively [50]. (b) Mathe et al. later proved that the distributions of a DNA homopolymer, poly(dA), produce different signals by measuring the residual current in the presence of immobilized hairpins [59]. (c) Molecular dynamics simulations show that the mechanism for the orientation selectivity involves preferential base orientation up or down at the smallest pore constriction, depending on the orientation entry see dashed circles [59]. Images obtained with permissions from the publishers.
Fig. 11
Fig. 11. Discrimination among RNA homopolymers
(a) Typical resistive pulses during the passage of different RNA homopolymers through an α-hemolysin channel [61]. The scheme below attributes differences in the depth of the pulses to secondary structure, as opposed to bulkiness of the bases. (b) Resistive pulses during translocation of the block co-polymer A30C70 show two distinct levels, corresponding to the sequential occupancy of each type of base in the pore [61]. (c) Various types of single-stranded and double-stranded nucleic acids discriminated among by the change in pore conductance (ΔG) they induce upon entry into a ~ 10 nm diameter silicon nitride nanopore [62]. (d) Resistive pulses of short DNA and RNA fragments using 3 nm diameter pores in ultrathin silicon nitride membranes, showing the sensitivity of small pores to bent structures such as transfer-RNA (V = 500 mV, T = 0 °C) [20]. Images obtained with permissions from the publishers.
Fig. 12
Fig. 12. Nucleic acid unzipping
(a) Unzipping time distributions for two different 50-bp duplex DNA molecules through an α-hemolysin pore, one of which contains a few mismatches (highlighted in sequence below the distributions). Gel images of PCR amplification products of the different strands following an unzipping experiment. Bottom shows the proposed two-step model of reversible unzipping/rezipping, followed by an irreversible unzipping process [63]. (b) Unzipping 10-bp DNA at different temperatures and voltage ramp rates reveals a transition between the reversible and the irreversible process (dashed line), both of which exhibit different kinetics [64]. (c) Unzipping duplex DNA molecules using a 2 nm diameter silicon nitride nanopore [68]. Scheme of the setup and TEM image of the pore are shown on top, while bottom shows pulse duration distributions for an ssDNA (dA120), a blunt 24-bp dsDNA hairpin (24B), and a 50-bp dsDNA with a 50-mer ssDNA overhang (HP50). The substantially longer time scales for HP50 suggests that unzipping requires an ssDNA as an electrophoretic “rope” for unzipping the DNA. (d) Multi-nanopore force spectroscopy [69]. Step a: Probe DNA molecules are threaded and anchored at the pore using a streptavidin molecule. Step b: Complementary probes are hybridized to the probe DNA at the trans chamber. Step c: Unhybridized probes are allowed to escape. Step d: Unzipping voltage is applied and current is recorded, providing the complete unzipping probability plot in one experiment. Step e: Reset step. Images obtained with permissions from the publishers. (For interpretation of the references to color in this figure, the reader is referred to the web version of this article.)
Fig. 13
Fig. 13. Probing intermolecular reactions in solution using nanopores
(a) Scatter plots for 100 nM BSA only (black) and 100 nM BSA plus 270 nM anti-BSA-Fab (red) for a 17 nm conical pore at 1 V applied bias [71]. (b) Probing reaction between the PBCV-1 virus and an antibody specific to it using a sub-micrometer pore in glass [72]. (c) Use of lipid-coated solid-state nanopores for sensing in real time the evolution of amyloid-beta (Aβ) peptides. The lipids serve an important function in preventing clogging of the pores during transport of the peptides through the pore [73]. (d) Detection of small-molecule binding to DNA. SYBR Green II (SGII) is a dye that binds to random ssDNA sequences but not to poly(dA) [74]. Images obtained with permissions from the publishers. (For interpretation of the references to color in this figure, the reader is referred to the web version of this article.)
Fig. 14
Fig. 14. Probing nucleic acid complexes using nanopores
(a) Probing DNA/enzyme complexes using an α-hemolysin pore [75]. The enzyme exo I binds to the 3′ terminus of ssDNA, although it does not bind a 3′-phosphorylated site, as seen by the event frequency as a function of time. (b) Probing DNA complexation with sequence-specific peptide nucleic acids (PNA) using a 4.5 nm solid-state pore [76]. Binding of the PNA to the DNA molecule results in an additional negative spike upon the complex's passage through the pore. (c) Probing DNA/RecA interactions using a 20 nm solid-state pore [79]. Addition of RecA dramatically enhances the signal from the DNA molecule, allowing its detection using larger pores. (d) Detecting RNA/drug complexation and affinity using a 3 nm ultrathin pore [80]. An excised RNA from the A-site of the prokaryotic ribosome produces a signal that changes upon binding aminoglycoside drugs such as paromomycin. Images obtained with permissions from the publishers.
Fig. 15
Fig. 15. Probing intermolecular dynamics using nanopores
(a) Ion current traces for an α-hemolysin pore that is tethered with oligo A in the vestibule region, before and after the addition of the complementary oligo B and following the subsequent addition of oligo A to compete with the hemolysin-bound oligo [81]. (b) Probing the dynamics of short DNA hairpins. The residence time of hairpins in the vestibule is plotted as a function of the duplex length, showing a logarithmic dependence of the event duration with the standard free energy of the duplex [82]. (c) Interrogating protein structure by electrostatically trapping the protein inside an α-hemolysin pore [83,84]. Engineering of the channel to contain aspartate residues on both ends of the β-barrel promoted the long-lived interactions of pb2-Ba with the channel, enabling its interrogation. Images obtained with permissions from the publishers.
Fig. 16
Fig. 16. Probing DNA internal structure and modified DNA bases
(a) Detection of DNA base modifications using α-hemolysin. The residual current IRES for various base modifications reports on their presence in a sequence [86]. (b) Detection of damaged DNA bases on a tethered DNA molecule using α-hemolysin [87,88]. Scheme shows trapping of a molecule, measurement of the residual current, followed by its release. The technique can discriminate among normal and damaged guanines. (c) Analysis of base-modified DNA properties using a 4 nm diameter solid-state pore [89]. Concatenated ion current traces of identical 3 kbp sequences that contain different cytosines show different transport dynamics, related to the DNA flexibility. (d) Detecting the perturbation of secondary DNA structure by urea [91]. Scatter plots show that ssDNA is more likely to thread into an α-hemolysin pore when urea is added, pointing to the destabilization of secondary structure. (e) Detection of pH-induced destabilization of secondary structure using 4 nm diameter solid-state nanopores [93]. A 3000 nucleotide long ssDNA translocates through a 4 nm diameter pore differently at pH 7 and pH 13, attributed to the denaturing ability of alkaline solutions. Images obtained with permissions from the publishers.
Fig. 17
Fig. 17. Exotic pore systems
(a) Pore–cavity–pore system for trapping and manipulating single biomolecules [98,99]. A TEM image of the device is shown, and a fluorescence study of molecular capture/release is shown, as well as an ion current trace collected from a λ-DNA molecule time-of-flight experiment [100]. (b) Biomimetic nuclear pore complex [103]. Modification of silicon nitride nanopores with nucleoporins allows protein selectivity, which simulates a function of the nuclear envelope. (c) Hybrid solid-state/α-hemolysin pore [105]. Ion current traces are shown during transport of the DNA tail (pink), partial docking (yellow), and full docking (green). (d) Tunneling detector at a nanopore [108]. The device is fabricated using ion and electron beams, and allowed transverse electronic detection of DNA molecules as they are electrophoretically driven through a nanopore. (e) Receptor-modified solid-state pores [112]. A gold-coated SiN pore is used to introduce a single receptor via self-assembly of a functional thiol, followed by specific receptor binding (e.g., Ni-NTA/histidine tag chemistry). (f) Mechanical manipulation at a pore [117]. Combining various force apparatuses allows biomolecules to be interrogated with better control at a nanopore. Images obtained with permissions from the publishers. (For interpretation of the references to color in this figure, the reader is referred to the web version of this article.)
Fig. 18
Fig. 18. DNA sequencing using nanopores
(a) Transverse electronic sequencing. Two approaches: cartoon [118] shows a single DNA strand being passed through a single-layer graphene nanopore while electrons are passed through the graphene ribbon [119,120], or, DNA is passed through an electrode gap and tunneling currents are recorded [–123]. (b) Optipore-based DNA sequencing. In this scheme biochemical preparation of the target DNA molecules converts each base into a longer sequence equipped with optical reporters, and unzipping of the sequence provides an array-based readout. Both the biochemical conversion and readout steps have been demonstrated [125]. (c) Exonuclease/pore sequencing. In this scheme, an exonuclease tethered to an adapter-fitted α-hemolysin channel is used to degrade the strand one base at a time, while each base is attracted to the pore, where the residual ion current is measured as a function of time. The traces show a real current trace from mononucleotides in the solution (not the actual sequence of a DNA molecule), which exhibits four characteristic levels corresponding to the four nucleotides [126, 127]. (d) Nanopore/mass-spectrometer apparatus for single-molecule DNA sequencing. In this concept, a DNA strand passing through an orifice is subjected to irradiation-induced fragmentation under vacuum, resulting in a sequence of cleaved nucleotides that are detected using a mass-spectrometer. (e) Ion current based sequencing using a polymerase motor. A complex of a DNA polymerase and a template strand/primer duplex is sucked into a pore, and each time a base is incorporated, the template strand is moved upwards [130]. Improved current resolution of a single base by a protein-tethered MspA channel can assist in the readout when combined with the polymerase motor approach [131,132]. Images obtained with permissions from the publishers.

Comment in

References

    1. Graham MD. The Coulter principle: Foundation of an industry. J Lab Autom. 2003;8:72–81.
    1. Coulter WH. 1953 US Patent #2,656,508.
    1. Deblois RW, Bean CP, Wesley RKA. Electrokinetic measurements with submicron particles and pores by resistive pulse technique. J Colloid Interface Sci. 1977;61:323–35.
    1. Bayley H, Martin CR. Resistive-pulse sensing – From microbes to molecules. Chem Rev. 2000;100:2575–94. - PubMed
    1. Bayley H, Jayasinghe L. Functional engineered channels and pores (Review). Molec Mem Bio. 2004;21:209–20. - PubMed

Publication types