

Cineradiography of monkey lip-smacking reveals putative precursors of speech dynamics
- PMID: 22658603
- PMCID: PMC3569518
- DOI: 10.1016/j.cub.2012.04.055
Cineradiography of monkey lip-smacking reveals putative precursors of speech dynamics
Abstract
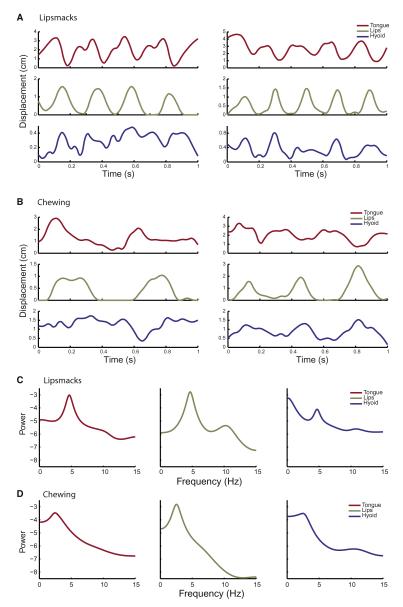
A key feature of speech is its stereotypical 5 Hz rhythm. One theory posits that this rhythm evolved through the modification of rhythmic facial movements in ancestral primates. If the hypothesis has any validity, then a comparative approach may shed some light. We tested this idea by using cineradiography (X-ray movies) to characterize and quantify the internal dynamics of the macaque monkey vocal tract during lip-smacking (a rhythmic facial expression) versus chewing. Previous human studies showed that speech movements are faster than chewing movements, and the functional coordination between vocal tract structures is different between the two behaviors. If rhythmic speech evolved through a rhythmic ancestral facial movement, then one hypothesis is that monkey lip-smacking versus chewing should also exhibit these differences. We found that the lips, tongue, and hyoid move with a speech-like 5 Hz rhythm during lip-smacking, but not during chewing. Most importantly, the functional coordination between these structures was distinct for each behavior. These data provide empirical support for the idea that the human speech rhythm evolved from the rhythmic facial expressions of ancestral primates.
Copyright © 2012 Elsevier Ltd. All rights reserved.
Figures


Similar articles
-
The evolution of speech: vision, rhythm, cooperation.Trends Cogn Sci. 2014 Oct;18(10):543-53. doi: 10.1016/j.tics.2014.06.004. Epub 2014 Jul 18. Trends Cogn Sci. 2014. PMID: 25048821 Free PMC article. Review.
-
Monkeys are perceptually tuned to facial expressions that exhibit a theta-like speech rhythm.Proc Natl Acad Sci U S A. 2013 Jan 29;110(5):1959-63. doi: 10.1073/pnas.1214956110. Epub 2013 Jan 14. Proc Natl Acad Sci U S A. 2013. PMID: 23319616 Free PMC article.
-
Facial expressions and the evolution of the speech rhythm.J Cogn Neurosci. 2014 Jun;26(6):1196-207. doi: 10.1162/jocn_a_00575. Epub 2014 Jan 23. J Cogn Neurosci. 2014. PMID: 24456390 Free PMC article. Review.
-
Monkey lipsmacking develops like the human speech rhythm.Dev Sci. 2012 Jul;15(4):557-68. doi: 10.1111/j.1467-7687.2012.01149.x. Epub 2012 Apr 19. Dev Sci. 2012. PMID: 22709404 Free PMC article.
-
Speech-like rhythm in a voiced and voiceless orangutan call.PLoS One. 2015 Jan 8;10(1):e116136. doi: 10.1371/journal.pone.0116136. eCollection 2015. PLoS One. 2015. PMID: 25569211 Free PMC article.
Cited by
-
The evolution of speech: vision, rhythm, cooperation.Trends Cogn Sci. 2014 Oct;18(10):543-53. doi: 10.1016/j.tics.2014.06.004. Epub 2014 Jul 18. Trends Cogn Sci. 2014. PMID: 25048821 Free PMC article. Review.
-
Monkey vocal tracts are speech-ready.Sci Adv. 2016 Dec 9;2(12):e1600723. doi: 10.1126/sciadv.1600723. eCollection 2016 Dec. Sci Adv. 2016. PMID: 27957536 Free PMC article.
-
Neurobiological roots of language in primate audition: common computational properties.Trends Cogn Sci. 2015 Mar;19(3):142-50. doi: 10.1016/j.tics.2014.12.008. Epub 2015 Jan 15. Trends Cogn Sci. 2015. PMID: 25600585 Free PMC article. Review.
-
Visual cortex entrains to sign language.Proc Natl Acad Sci U S A. 2017 Jun 13;114(24):6352-6357. doi: 10.1073/pnas.1620350114. Epub 2017 May 30. Proc Natl Acad Sci U S A. 2017. PMID: 28559320 Free PMC article.
-
Sequence and hierarchy in vocal rhythms and phonology.Ann N Y Acad Sci. 2019 Oct;1453(1):29-46. doi: 10.1111/nyas.14215. Epub 2019 Aug 14. Ann N Y Acad Sci. 2019. PMID: 31410865 Free PMC article. Review.
References
-
- Greenberg S, Carvey H, Hitchcock L, Chang S. Temporal properties of spontaneous speech–a syllable-centric perspective. J. Phonetics. 2003;31:465–485.
-
- MacNeilage PF. The frame/content theory of evolution of speech production. Behav. Brain Sci. 1998;21:499–511. discussion 511–546. - PubMed
-
- MacNeilage PF. The Origin of Speech. Oxford University Press; Oxford, UK: 2008.
-
- Hiiemae KM, Palmer JB. Tongue movements in feeding and speech. Crit. Rev. Oral Biol. Med. 2003;14:413–429. - PubMed
Publication types
MeSH terms
Grants and funding
LinkOut - more resources
Full Text Sources
