. 2012 Aug 15;368(2):261-72.
doi: 10.1016/j.ydbio.2012.05.024. Epub 2012 May 30.

Tbl3 regulates cell cycle length during zebrafish development

Affiliations

Tbl3 regulates cell cycle length during zebrafish development

Sarah A Hutchinson et al. Dev Biol. .

Abstract

The regulation of cell cycle rate is essential for the correct timing of proliferation and differentiation during development. Changes to cell cycle rate can have profound effects on the size, shape and cell types of a developing organ. We previously identified a zebrafish mutant ceylon (cey) that has a severe reduction in T cells and hematopoietic stem/progenitor cells (HSPCs). Here we find that the cey phenotype is due to absence of the gene transducin (beta)-like 3 (tbl3). The tbl3 homolog in yeast regulates the cell cycle by maintaining rRNA levels and preventing p53-induced cell death. Zebrafish tbl3 is maternally expressed, but later in development its expression is restricted to specific tissues. Tissues expressing tbl3 are severely reduced in cey mutants, including HSPCs, the retina, exocrine pancreas, intestine, and jaw cartilage. Specification of these tissues is normal, suggesting the reduced size is due to a reduced number of differentiated cells. Tbl3 MO injection into either wild-type or p53-/- mutant embryos phenocopies cey, indicating that loss of tbl3 causes specific defects in cey. Progression of both hematopoietic and retinal development is delayed beginning at 3 day post fertilization due to a slowing of the cell cycle. In contrast to yeast, reduction of Tbl3 causes a slowing of the cell cycle without a corresponding increase in p53 induced cell death. These data suggest that tbl3 plays a tissue-specific role regulating cell cycle rate during development.


Figures

Figure 1
Figure 1. Many tissue types are severely reduced in cey mutants
All figures are oriented anterior to the left. p56lck labels T cells in 4 dpf zebrafish larvae (A, yellow arrow). Cey mutants have severely reduced p56lck expression at 4 dpf (B, yellow arrow) suggesting a lack of T cells. In comparison to live wild-type larvae at 4 dpf (C), live cey mutants (D) have small eyes, heart edema (red arrow), and a deformed jaw (black arrow). Yellow dotted line designates the swim bladder (C, D). Although the tail is morphologically normal, there is a severe reduction of HSPCs in cey mutants at 4 dpf as shown by the severe reduction of c-myb positive cells in cey mutants (F) as compared to wild-type (E). Alcian blue staining indicates the mandibular and hyoid arches are smaller and malformed in cey mutants at 5 dpf (H) as compared to wild-type (G). Endodermal derivatives are severely reduced in cey mutants (I - L). Intestinal tissue labeled with ifabp is severely reduced in cey mutants at 4 dpf (I, J). In addition, exocrine pancreas labeled by trypsin is severely reduced in mutants at 5 dpf (K, L). The eyes of cey mutants are smaller than wild-type eyes at 5 dpf (M, N). Despite the smaller eye size, all cell layers are present in cey mutant retinas (O, P). Red asterisks label each retinal layer (O, P). Scale bars are 130 μm (A-L) and 95 μm (M-P).
Figure 2
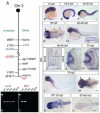
Figure 2. tbl3 is specifically expressed in wild-type and lost in cey mutants
Mapping the cey lesion revealed a telomeric deletion on chromosome 3 (A, not to scale). Double dashed lines indicate the approximate location of the deletion. Z-markers are listed on the left of the chromosome schematic and genes are on the right. The gene sox9b is excluded from the deletion (B), while tbl3 is included in the deletion (C). Radiation hybrid mapping indicates that tbl3 is located on the very end of the telomere on chromosome 3 and is closely linked to the noxo1a (GenBank ID: NM_001077584.1) gene (A). tbl3 is maternally expressed at the 8-cell stage (D). By 19.5 hpf tbl3 is still widely expressed in most tissues with high expression in the eye (E). tbl3 is expressed in most tissues between 29-30 hpf (F). At 35 hpf tbl3 expression is high in the eye and brain (E) and by 46-48 hpf (F) expression is present in the intestinal region (green arrowhead) and the HSPCs (inset – larvae in inset is different than larvae in the panel). Cross sections confirm that tbl3 is expressed between the dorsal aorta (red asterisk) and the caudal vein (yellow asterisk) at 45-48 hpf where HSPCs are found (I). Cross sections of the retina at 45-48 hpf (J) and 75 hpf (K) show that tbl3 is expressed around the lens (arrow) and in the retinal stem cell region, also known as the ciliary marginal zone (CMZ; asterisks) at the lateral edge of the retina adjacent to the lens. At 75 hpf (K) tbl3 is also expressed in the inner nuclear layer (bracket). tbl3 expression remains high in the eye (black), brain, fin bud (blue), and gut (green) at 75 hpf (L, M). Consistent with the loss of the tbl3 gene in cey, tbl3 expression is absent in cey mutant embryos (N, O). Accession numbers for other genes on the chromosome in (A) are as follows: foxj1a (GenBank ID: NM_001076706.2), zgc:152997 (GenBank ID: NM_001077319.1), sox8 (GenBank ID: NM_001025465.1), and zgc:113100 (GenBank ID: NM_001031844.1). Scale bars are 60 μm (I), 130 μm (D - H, J – O), and 245μm (N, O).
Figure 3
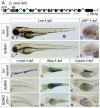
Figure 3. tbl3MO phenocopies the cey mutant
The tbl3 gene is 2,694 base pairs and 25 exons long (A). Black boxes represent exons and lines joining boxes are introns. Lines with hash marks indicate introns of unknown length. Red lines above exons represent the location of the MO sequence used in this study. Blue lines represent WD repeats. Orange line represents UTP13 domain (A). SB MO is directed against the splice donor site at the 3′ end of exon 5 (A). Injection of MOs designed against the tbl3 gene results in a phenocopy of the cey mutant phenotype at 4 dpf. tbl3 morphant 4 dpf larvae have malformed jaws (black arrows), small eyes (white arrows; B, C) and a reduction of T cells labeled by p56lck (D, E) as compared to uninjected controls. HSPCs labeled by c-myb (F, I), intestinal cells labeled by ifabp (G, J), and exocrine pancreas labeled by trypsin (H, K) are all severely reduced as compared to controls and similar to cey mutants (Figure 1). Images of larvae labeled with trypsin are pictures of the right side of the embryo reflected so that anterior is to the right (H, K, N). Injection of the tbl3MO into p53−/− mutants resulted in similar phenotypes (L – N) as compared to injection of tbl3MO into wild-type (I – K). Scale bars are 130μm.
Figure 4
Figure 4. Loss of HSPCs differentially affects hematopoietic lineages
CD41::eGFPlow labels HSPCs (A, A’ white arrowheads) while CD41::eGFPhigh labels thrombocytes (A, A’ white asterisks) in the CHT of 4 dpf larvae. HSPCs (white arrowheads) are severely reduced in tbl3 morphants at 4 dpf (B, B’) as compared to uninjected wild-type controls (A, A’). In contrast, thrombocytes in tbl3 morphants are unaffected (A, A’, B, B’). There are 24.9+/− 10.2 thrombocytes in the CHT in wild-type (N = 28 larvae), and 29+/−11.8 in the CHT of cey (N = 28) which is an insignificant difference (p-value = 0.16). Brightfield images in (A) and (B) are the same larvae as (A’) and (B’) respectively. Dotted yellow boxes indicate area in CHT counted in G. Neutrophils labeled by mpx are unaffected in cey larvae (D) at 6 dpf as compared to wild-type (C), while red blood cells labeled by βE1-globin at 6 dpf are severely reduced in cey (E, F). The average number of HSPCs in the CHT of tbl3 morphants is normal at 2 dpf, but significantly reduced at 3 and 4 dpf (G). The average number of mitotic cells in the CHT of tbl3 morphant larvae is not significantly affected at 2 or 3 dpf, but is severely reduced at 4 dpf (H). The number of CD41::eGFPlow+/pH3+ cells is not significantly changed in the CHT of tbl3 morphant larvae at 3 or 4 dpf (I). The area of the CHT counted in (G - I) is labeled by the yellow dotted lines in (A), (A’), (B) and (B’). The error bars in (G) and (H) represent standard error of the mean. The error in (I) represents standard deviation. Scale bars are 130μm.
Figure 5
Figure 5. RPC markers are expanded in central retina despite smaller eyes and fewer cells in cey mutants
The eyes of cey mutants are smaller than wild-type eyes by 3 dpf in the medial/lateral, anterior/posterior and dorsal/ventral axes (A). This difference is maintained at all time points (A). In addition, the number of cells in each layer is significantly reduced in cey mutants (B), resulting in a reduction of eye size. The number of cells in each layer was estimated by averaging number of TO-PRO-3 stained nuclei in five z-sections 10 μm apart in six different larvae (see Materials and Methods). Retinal stem cell markers are maintained longer in the central retina (black arrowheads) of cey mutants than in wild-types (C-H). vsx2 and notch1a are expressed in the peripheral retina of the wild-type 4 dpf retina (C, G), but are expressed throughout the central (black arrowheads) and peripheral retina in cey (D, H). Cross sections of 4 dpf retinas expressing vsx2 show that vsx2 is expressed in more cells in the CMZ region of mutant retinas (asterisks) and throughout the outer nuclear layer (black arrow E, F). The small eye and expansion of vsx2 expression into the central retina (black arrowheads) is phenocopied in tbl3 morphants at 4 dpf (I, J). The abbreviations in (B) are as follows: ganglion cell layer (GCL), inner nuclear cell layer (INL), outer nuclear cell layer (ONL), photoreceptor layer (PRL). The error bars in (A) and (B) represent the standard error of the mean. Scale bars are130 m.
Figure 6
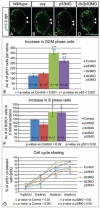
Figure 6. Prolonged proliferative phase in retina results from slowing of the cell cycle
Proliferation is increased in cey mutant retinas. At 3 dpf there are more pH3+ (G2/M) cells in cey mutants in the central retina (white arrowheads; B) as compared to wild-type (A). Injection of both tbl3 MO and p53 MO also results in an increase in pH3+ cells in the central retina (white arrowheads) at 3 dpf (D) as compared to a p53MO only control (C). Quantification shows that the increase in pH3+ cells is significant in both larvae injected with tbl3MO alone or tbl3MO co-injected with p53MO at 3 dpf (E). Control larvae were injected with phenol red. Whole Z-stacks of dorsal view retinas were projected and the number of pH3+ cells were counted and then averaged to determine the average number of mitotic cells at 3 dpf (E, see methods for more details on quantification). Tbl3 morphants also have an increased number of cells in S-phase as compared to wild-type (F) indicating there are more proliferating cells at 3 dpf. The average number of BrdU positive cells in five lateral view sections was calculated for each retina (F, see methods for more details). The progression of cells from S-phase to G2/M is \Tbl3 morphants than control embryos as is indicated by the smaller percentage of cells co-labeled with BrdU and anti-pH3 over a 6 hour period of BrdU recovery (G). At 1 hpBrdU N = 4, 8, 9, 8 for control, p53MO, tbl3MO, and tbl3p53MO respectively. At 2 hpBrdU N = 4, 4, 5, 5. At 4 hpBrdU N = 7, 4, 4, 5. At 6 hpBrdU N = 9, 11, 8, 6. Error bars in (E - G) represent standard error of the mean. Scale Bars are 130μm.

Similar articles

Cited by

References

    1. Agathocleous M, Harris WA. From progenitors to differentiated cells in the vertebrate retina. Annual review of cell and developmental biology. 2009;25:45–69. - PubMed
    1. Aifantis I, Raetz E, Buonamici S. Molecular pathogenesis of T-cell leukaemia and lymphoma. Nat Rev Immunol. 2008;8:380–390. - PubMed
    1. Akimenko MA, Ekker M, Wegner J, Lin W, Westerfield M. Combinatorial expression of three zebrafish genes related to distal-less: part of a homeobox gene code for the head. J Neurosci. 1994;14:3475–3486. - PMC - PubMed
    1. Alexiades MR, Cepko C. Quantitative analysis of proliferation and cell cycle length during development of the rat retina. Dev Dyn. 1996;205:293–307. - PubMed
    1. Austin CP, Feldman DE, Ida JA, Jr., Cepko CL. Vertebrate retinal ganglion cells are selected from competent progenitors by the action of Notch. Development. 1995;121:3637–3650. - PubMed

Publication types

MeSH terms