

Viruses in nondisinfected drinking water from municipal wells and community incidence of acute gastrointestinal illness
- PMID: 22659405
- PMCID: PMC3440111
- DOI: 10.1289/ehp.1104499
Viruses in nondisinfected drinking water from municipal wells and community incidence of acute gastrointestinal illness
Abstract
Background: Groundwater supplies for drinking water are frequently contaminated with low levels of human enteric virus genomes, yet evidence for waterborne disease transmission is lacking.
Objectives: We related quantitative polymerase chain reaction (qPCR)-measured enteric viruses in the tap water of 14 Wisconsin communities supplied by nondisinfected groundwater to acute gastrointestinal illness (AGI) incidence.
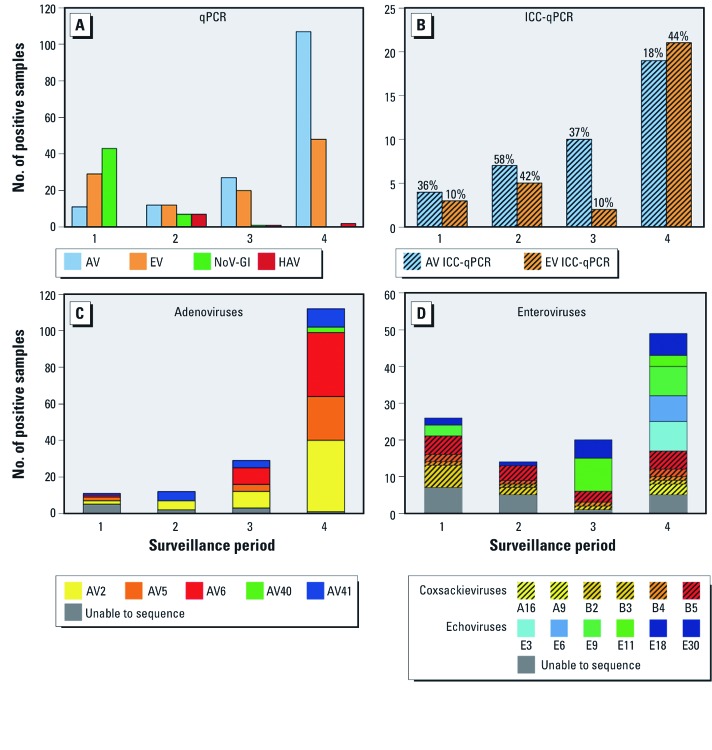
Methods: AGI incidence was estimated from health diaries completed weekly by households within each study community during four 12-week periods. Water samples were collected monthly from five to eight households per community. Viruses were measured by qPCR, and infectivity assessed by cell culture. AGI incidence was related to virus measures using Poisson regression with random effects.
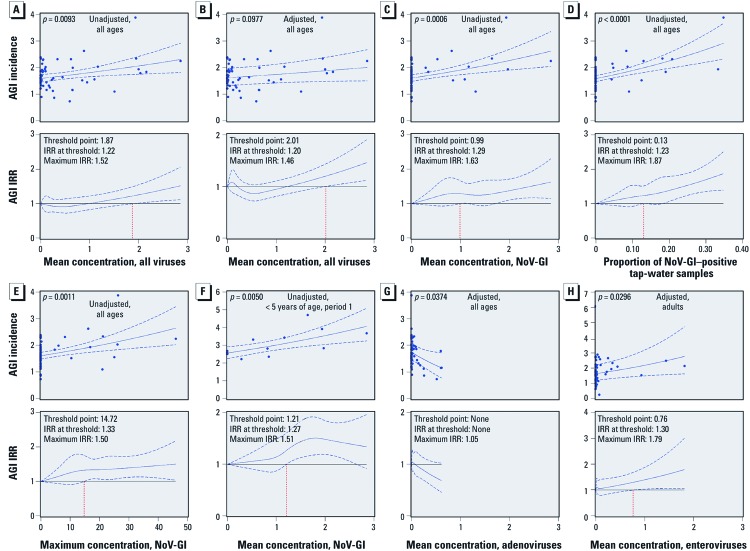
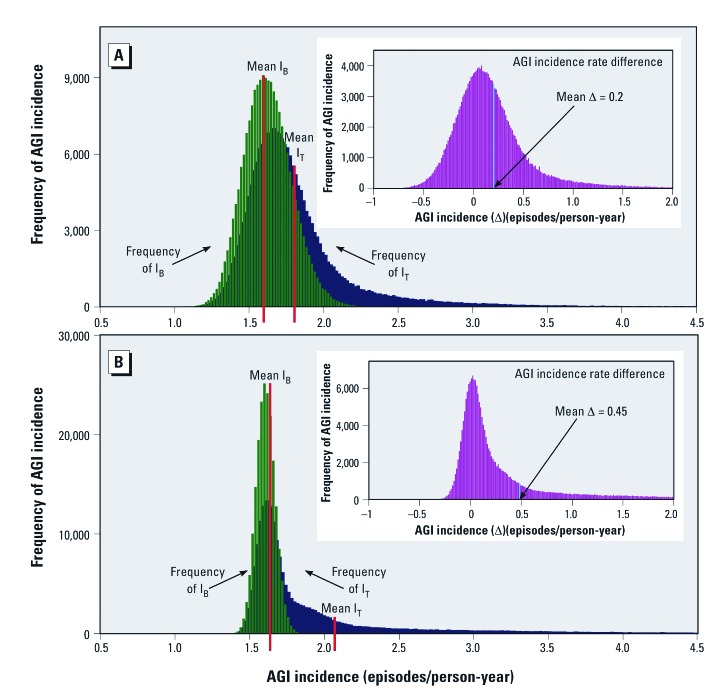
Results: Communities and time periods with the highest virus measures had correspondingly high AGI incidence. This association was particularly strong for norovirus genogroup I (NoV-GI) and between adult AGI and enteroviruses when echovirus serotypes predominated. At mean concentrations of 1 and 0.8 genomic copies/L of NoV-GI and enteroviruses, respectively, the AGI incidence rate ratios (i.e., relative risk) increased by 30%. Adenoviruses were common, but tap-water concentrations were low and not positively associated with AGI. The estimated fraction of AGI attributable to tap-water-borne viruses was between 6% and 22%, depending on the virus exposure-AGI incidence model selected, and could have been as high as 63% among children < 5 years of age during the period when NoV-GI was abundant in drinking water.
Conclusions: The majority of groundwater-source public water systems in the United States produce water without disinfection, and our findings suggest that populations served by such systems may be exposed to waterborne viruses and consequent health risks.
Conflict of interest statement
The authors declare they have no actual or potential competing financial interests.
Figures
References
-
- Abbaszadegan M, LeChevallier MW, Gerba CP. Occurrence of viruses in U.S. groundwaters. J Am Water Works Assoc. 2003;95:107–120.
-
- Borchardt MA, Bradbury KR, Gotkowitz MB, Cherry JA, Parker BL. Human enteric viruses in groundwater from a confined bedrock aquifer. Environ Sci Technol. 2007;41:6606–6612. - PubMed
-
- Brunkard JM, Ailes E, Roberts VA, Hill V, Hilborn ED, Craun GF, et al. Surveillance for waterborne disease outbreaks associated with drinking water—United States, 2007–2008. MMWR Surveill Summ. 2011;60(12):38–68. - PubMed
-
- Colford JM, Jr, Roy S, Beach MJ, Hightower A, Shaw SE, Wade TJ. A review of household drinking water intervention trials and an approach to the estimation of endemic waterborne gastroenteritis in the United States. J Water Health. 2006;4(suppl. 2):71–88. - PubMed
-
- Cramblett HG, Moffet HL, Middleton GK, Jr, Black JP, Shulenberger H, Yongue A. ECHO 19 virus infections. Clinical and laboratory studies. Arch Intern Med. 1962;110:574–579. - PubMed
Publication types
MeSH terms
Substances
LinkOut - more resources
Full Text Sources
Medical
Miscellaneous
