. 2012 Aug 1;303(3):L169-80.
doi: 10.1152/ajplung.00108.2012. Epub 2012 Jun 1.

Improved throughput traction microscopy reveals pivotal role for matrix stiffness in fibroblast contractility and TGF-β responsiveness

Affiliations

Improved throughput traction microscopy reveals pivotal role for matrix stiffness in fibroblast contractility and TGF-β responsiveness

Aleksandar Marinković et al. Am J Physiol Lung Cell Mol Physiol. .

Abstract

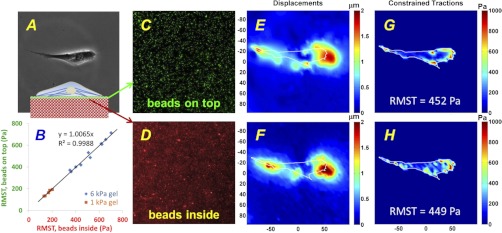
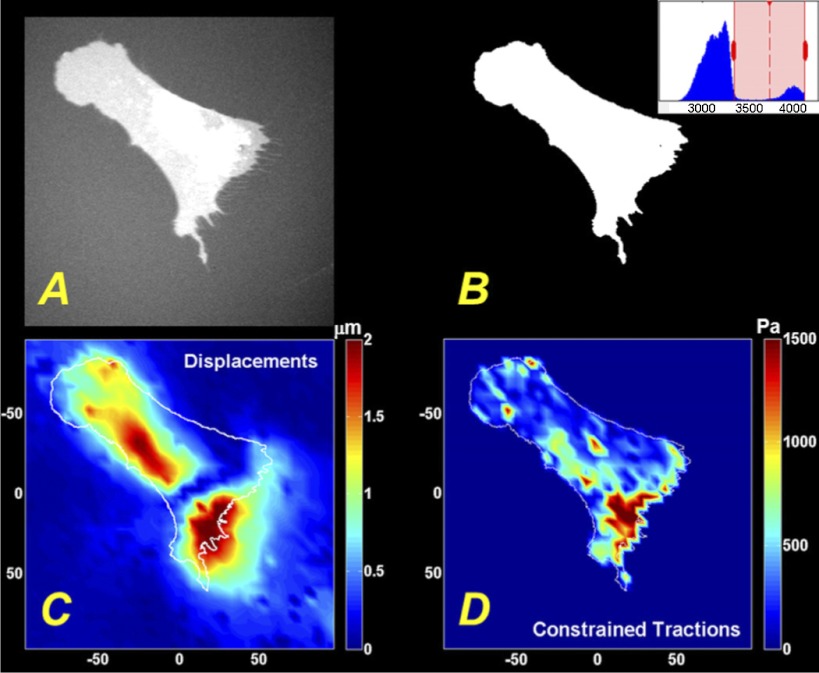
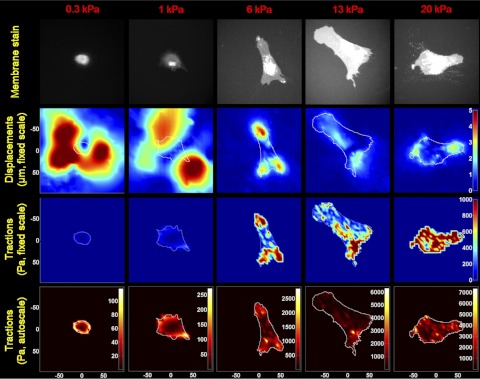
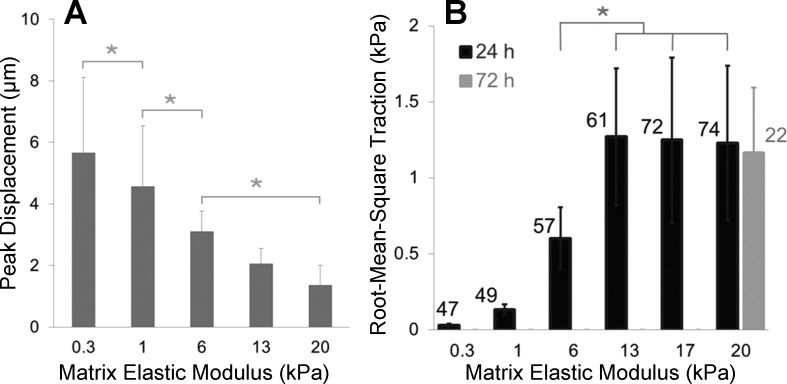
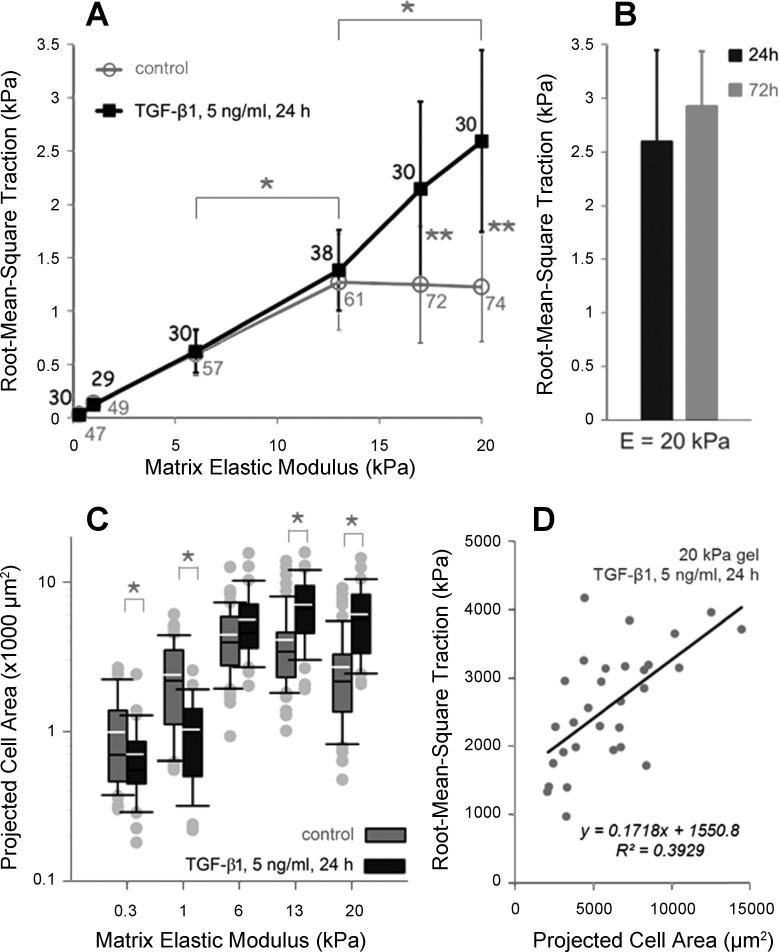
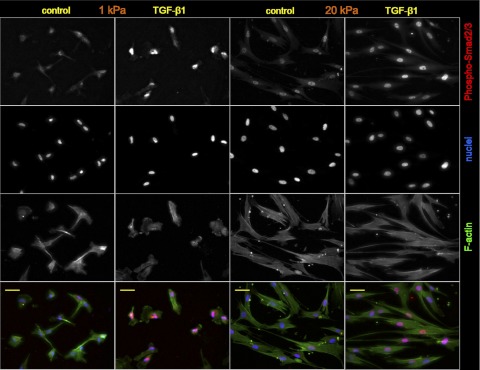
Lung fibroblast functions such as matrix remodeling and activation of latent transforming growth factor-β1 (TGF-β1) are associated with expression of the myofibroblast phenotype and are directly linked to fibroblast capacity to generate force and deform the extracellular matrix. However, the study of fibroblast force-generating capacities through methods such as traction force microscopy is hindered by low throughput and time-consuming procedures. In this study, we improved at the detail level methods for higher-throughput traction measurements on polyacrylamide hydrogels using gel-surface-bound fluorescent beads to permit autofocusing and automated displacement mapping, and transduction of fibroblasts with a fluorescent label to streamline cell boundary identification. Together these advances substantially improve the throughput of traction microscopy and allow us to efficiently compute the forces exerted by lung fibroblasts on substrates spanning the stiffness range present in normal and fibrotic lung tissue. Our results reveal that lung fibroblasts dramatically alter the forces they transmit to the extracellular matrix as its stiffness changes, with very low forces generated on matrices as compliant as normal lung tissue. Moreover, exogenous TGF-β1 selectively accentuates tractions on stiff matrices, mimicking fibrotic lung, but not on physiological stiffness matrices, despite equivalent changes in Smad2/3 activation. Taken together, these results demonstrate a pivotal role for matrix mechanical properties in regulating baseline and TGF-β1-stimulated contraction of lung fibroblasts and suggest that stiff fibrotic lung tissue may promote myofibroblast activation through contractility-driven events, whereas normal lung tissue compliance may protect against such feedback amplification of fibroblast activation.


Figures

Fig. 1.
Fig. 1.
Experimental validation of improved methods for traction measurements. A: top-down phase-contrast image of an IMR-90 fibroblast seeded at low density on a polyacrylamide gel coated with collagen I. Fluorescent beads were both embedded inside and conjugated on top of the gel, as illustrated in the transverse inset. Elastic modulus of the gel was 6 kPa. B: 2D scatter plot of root mean square tractions (RMSTs) calculated for multiple cells using images of the beads inside the gel (abscissa) vs. beads on top of the gel (ordinate). Tractions were computed for cells seeded on substrates with elastic moduli of 1 and 6 kPa. 95% confidence interval for the slope of linear regression with zero intercept was (0.9864, 1.0266). C and D: fluorescent images of the same field of view in A showing 200-nm beads linked on top of the gel (green, C) and beads inside the gel (red, D) taken using the same focal plane setting. All images were obtained at ×20 magnification. E and F: displacement fields computed from the fluorescent images of the beads taken before and after cell detachment by trypsin-EDTA treatment. Colors denote absolute magnitudes of displacements, in μm (see color bars). Labels at the axes, in μm, indicate the length scale. Displacement field was computed either from the fluorescent images of the beads on top of the gel (C) or from the images of the beads embedded in the gel (D), all taken at the same focal plane. G and H: traction fields computed from the displacement fields in C and D. Colors denote the magnitudes of traction vectors in Pa (see color bars). RMSTs were computed for both traction fields and shown on the maps as RMST values. EH: outline of the cell shown in A was superposed on the maps of displacement and traction fields.
Fig. 2.
Fig. 2.
Automation of cell boundary detection for traction mapping. A: IMR-90 fibroblasts were transduced with CellLight Plasma Membrane-RFP immediately after seeding on polyacrylamide (PA) substrate (elastic modulus of the gel was 13 kPa), and fluorescent image was taken after 24 h. B: cell boundary was detected by using a simple threshold algorithm. Inset: Matlab generated histogram showing the distribution of intensities in the image, with the red rectangle denoting the pixel intensities above the user-defined threshold. C: displacement field computed from the fluorescent images of the beads conjugated on top of the gel. Color-coded absolute magnitudes of displacements are shown on the color bar, in μm. D: traction field computed from displacement field in C. Color-coded magnitudes of traction vectors are shown on the color bars, in Pa. C and D: labels at the axes indicate the length scale, in μm. Outline of the cell in B was superposed on the maps of displacement and traction fields.
Fig. 3.
Fig. 3.
Cell-mediated displacements and tractions vary across matrix stiffness conditions. Fibroblasts were seeded on PA gels with discrete elastic moduli of 0.3, 1, 6, 13, and 20 kPa. Each column in the figure corresponds to a discrete substrate stiffness indicated at the top of the column. Row 1 shows fluorescent images of the cells transduced with CellLight Plasma Membrane-RFP; row 2 shows displacement fields from surface-conjugated fluorescent beads; row 3 shows the corresponding traction fields displayed using a fixed traction scale across all matrix stiffness conditions; row 4 shows the same traction fields using an autoscaled traction scale to better visualize the pattern of tractions within each image. In the second row, color-coded magnitudes of displacements are fixed to a single length scale, in μm, shown on the color bar in the right-most column. In the third row, color-coded magnitudes of traction vectors, in Pa, are shown on the color bar in the right-most column. In the fourth row, color-coded magnitudes of tractions, in Pa, are indicated on the color bars next to each map in the row. Labels at the axes indicate the length scale, in μm.
Fig. 4.
Fig. 4.
Peak displacements and RMSTs exhibit opposite trends across matrix stiffness conditions. A: bar plot showing peak displacements found in displacement fields from all cells whose tractions are reported in B. Lung fibroblasts were seeded at low density on PA substrates of discrete stiffnesses for 24 h. Data are means ± SD (n ≥ 47). Asterisk indicates statistically significant differences in peak displacements (P < 0.05, 1-way ANOVA followed by Tukey's test). B: RMSTs measured by high-throughput traction microscopy. Data are means ± SD (n ≥ 47 cells, as indicated on the chart next to each bar). Asterisk indicates statistically significant differences between RMSTs on substrate stiffness of 6 vs. 13, 17, or 20 kPa (P < 0.0001, 1-way ANOVA followed by Tukey's test). The gray bar on the right demonstrates that tractions measured on 20-kPa substrates at 72 h after seeding were statistically indistinguishable from those measured at 24 h after seeding.
Fig. 5.
Fig. 5.
Increased cell-to-cell variation in force-generating capacity emerges with increasing matrix stiffness. A: coefficients of variation (SD/mean, CVs) in RMST calculated at discrete substrate stiffnesses using the data in Fig. 4B. B: RMST time courses measured on substrates with elastic moduli of 1 and 13 kPa (9 and 6 cells, respectively), with RMST for each cell normalized to its value at arbitrary time zero. C: temporal CV was calculated for each cell shown in B based on the SD and mean of tractions measured over the time course. The mean and SD of the CVs across cells for the 2 stiffness conditions were then calculated and shown here. Asterisk indicates statistically significant difference in mean CVs at 0.05 level of significance (P = 0.0104, 2-tailed t-test assuming unequal variances), demonstrating lower temporal fluctuations in tractions on the stiffer substrate.
Fig. 6.
Fig. 6.
Cell spreading varies across stiffness conditions but does not correlate with cell-to-cell variation in tractions. A: distributions of projected cell areas for cells whose traction fields were measured across the range of substrate stiffnesses. Dashed lines within the boxes represent the means of area distributions. Boxes represent the 25th and 75th percentiles; whiskers indicate 10th and 90th percentiles. Asterisk indicates statistically significant difference between projected cell areas (P < 0.05, 1-way ANOVA followed by Tukey's test). B: linear regression model fitted to scattered data of projected cell area vs. RMST on substrates with elastic modulus of 20 kPa. 95% confidence interval for the slope of linear regression line was (−0.6031, 1.3635).
Fig. 7.
Fig. 7.
TGF-β1 selectively promotes fibroblast tractions on stiff matrices. A: IMR-90 fibroblasts were seeded on PA substrates of discrete stiffness and treated with 5 ng/ml of activated TGF-β1 for 24 h. RMSTs computed for treated cells across 6 stiffness conditions are shown (dark line). Data are means ± SD (n ≥ 29 cells, as indicated on the plot next to each data point). As a comparison, data from untreated controls are replotted from Fig. 4A (gray line). Asterisks indicate statistically significant differences between RMSTs both within (*P < 0.01, 1-way ANOVA followed by Tukey's test) and across (**P < 0.0001, 2-tailed t-test) treatment conditions. B: Bar plot of RMSTs measured on PA gel substrates with Young's modulus of 20 kPa, 24 (dark) and 72 (gray) h after treatment with 5 ng/ml of TGF-β1 (P = 0.0723 vs. 24 h, 2-tailed t-test). C: distributions of projected cell areas of fibroblasts treated with TGF-β1 (gray boxes) across the range of substrate stiffnesses. As a comparison, distributions of projected cell areas of untreated controls are replotted from Fig. 6A (dark boxes). Asterisk indicates statistically significant difference between projected cell areas in TGF-β1-treated cells vs. controls (*P < 0.05, 2-tailed t-test). D: linear regression model fitted to scattered data of projected cell area vs. RMST from the fibroblasts treated with TGF-β1 and cultured on the substrates with elastic modulus of 20 kPa. 95% confidence interval for the slope of linear regression line was (1.1862, 3.3870).
Fig. 8.
Fig. 8.
Phosphorylation of SMAD2/3 on soft and stiff matrices. Confocal immunofluorescence images of serum-starved IMR-90 fibroblasts grown on PA substrates with elastic moduli of 1 kPa (columns 1 and 2) or 20 kPa (columns 3 and 4), untreated (columns 1 and 3, control) or treated (columns 2 and 4) with human TGF-β1 (5 ng/ml, 45 min). The cells were stained for phospho-Smad2/3 (red), F-actin (phalloidin, green), and nuclei (Hoechst 33342 counterstain, blue). Scale bars = 50 μm. Results from multiple images are summarized in Table 1.

Similar articles

Cited by

References

    1. Ailenberg M, Tung PS, Fritz IB. Transforming growth factor-beta elicits shape changes and increases contractility of testicular peritubular cells. Biol Reprod 42: 499–509, 1990 - PubMed
    1. Annes JP, Chen Y, Munger JS, Rifkin DB. Integrin alphaVbeta6-mediated activation of latent TGF-beta requires the latent TGF-beta binding protein-1. J Cell Biol 165: 723–734, 2004 - PMC - PubMed
    1. Arora PD, Narani N, McCulloch CA. The compliance of collagen gels regulates transforming growth factor-beta induction of alpha-smooth muscle actin in fibroblasts. Am J Pathol 154: 871–882, 1999 - PMC - PubMed
    1. Balaban NQ, Schwarz US, Riveline D, Goichberg P, Tzur G, Sabanay I, Mahalu D, Safran S, Bershadsky A, Addadi L, Geiger B. Force and focal adhesion assembly: a close relationship studied using elastic micropatterned substrates. Nat Cell Biol 3: 466–472, 2001 - PubMed
    1. Brown RA, Sethi KK, Gwanmesia I, Raemdonck D, Eastwood M, Mudera V. Enhanced fibroblast contraction of 3D collagen lattices and integrin expression by TGF-beta1 and -beta3: mechanoregulatory growth factors? Exp Cell Res 274: 310–322, 2002 - PubMed

Publication types