. 2012 Jun 3;15(7):1040-6.
doi: 10.1038/nn.3130.

Rational regulation of learning dynamics by pupil-linked arousal systems

Affiliations

Rational regulation of learning dynamics by pupil-linked arousal systems

Matthew R Nassar et al. Nat Neurosci. .

Abstract

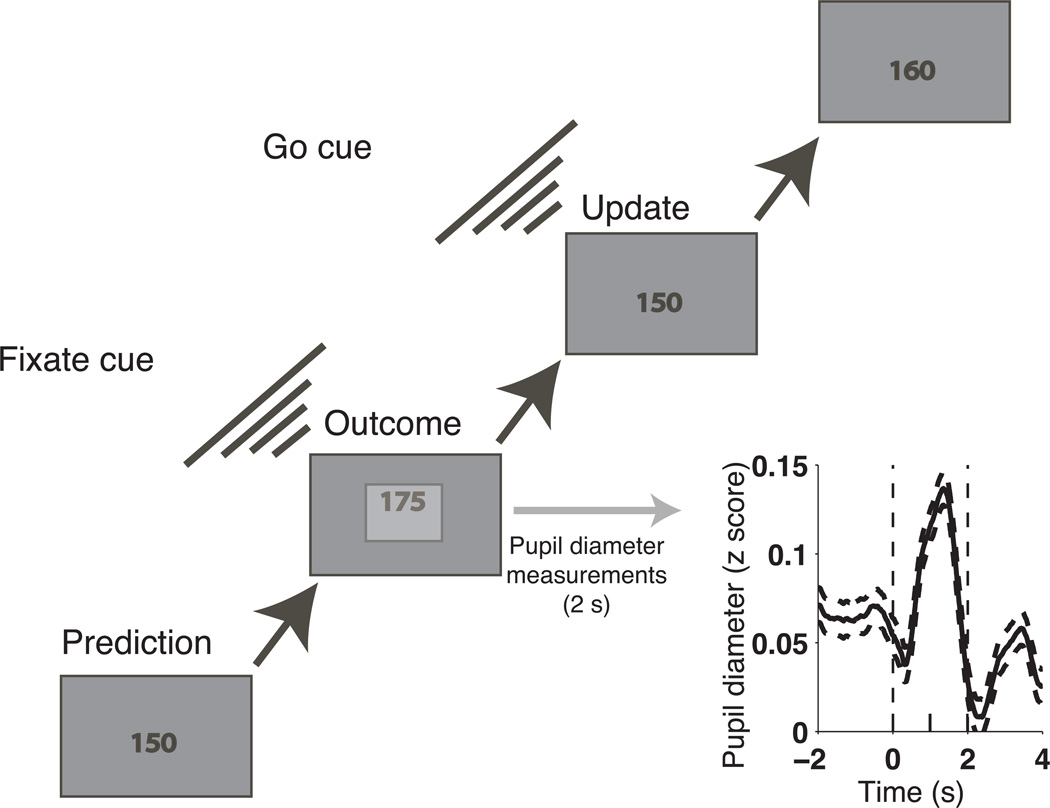
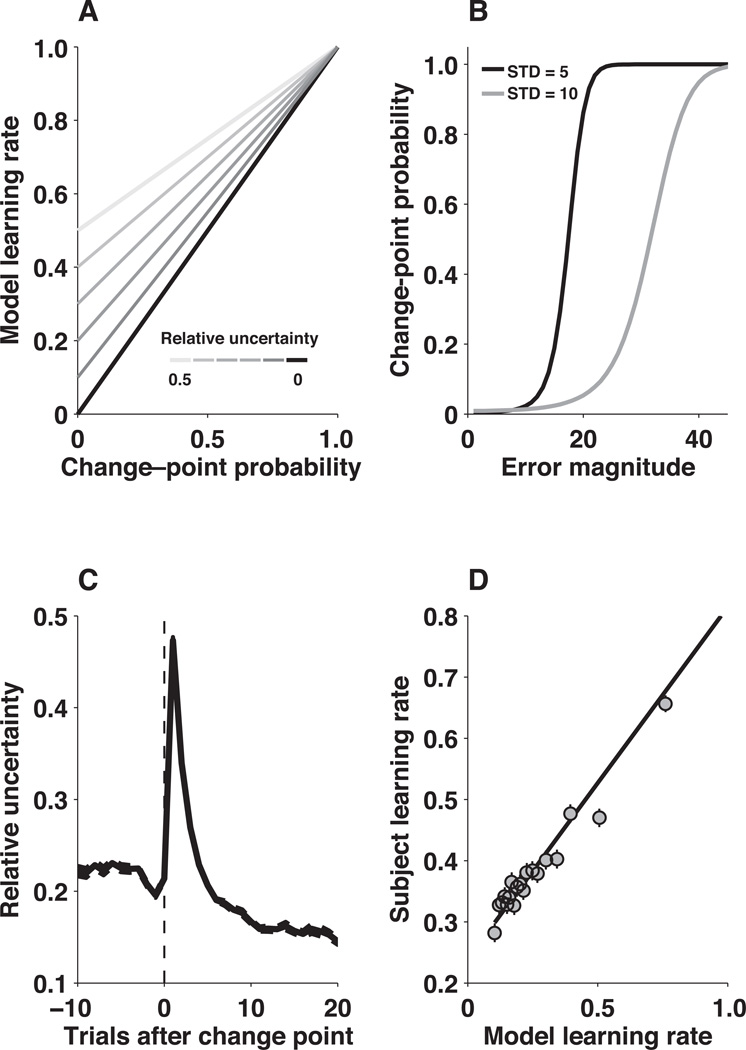
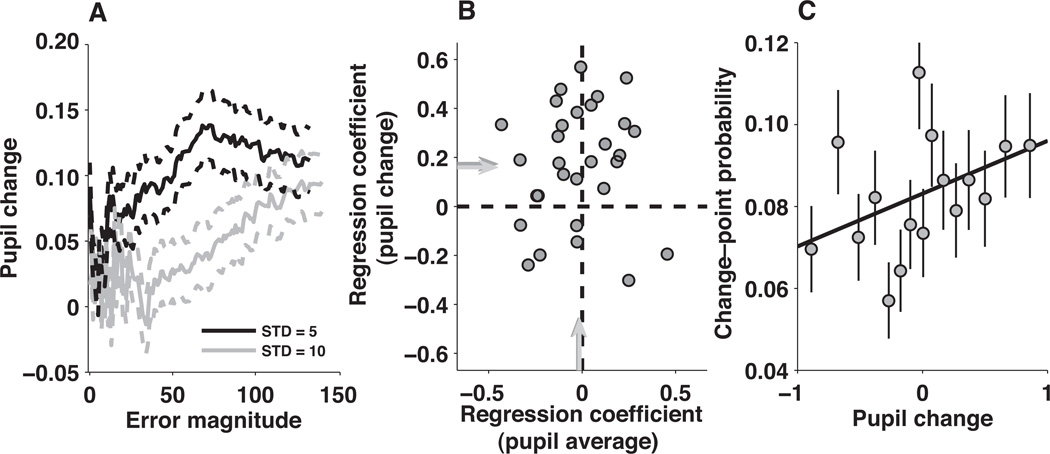
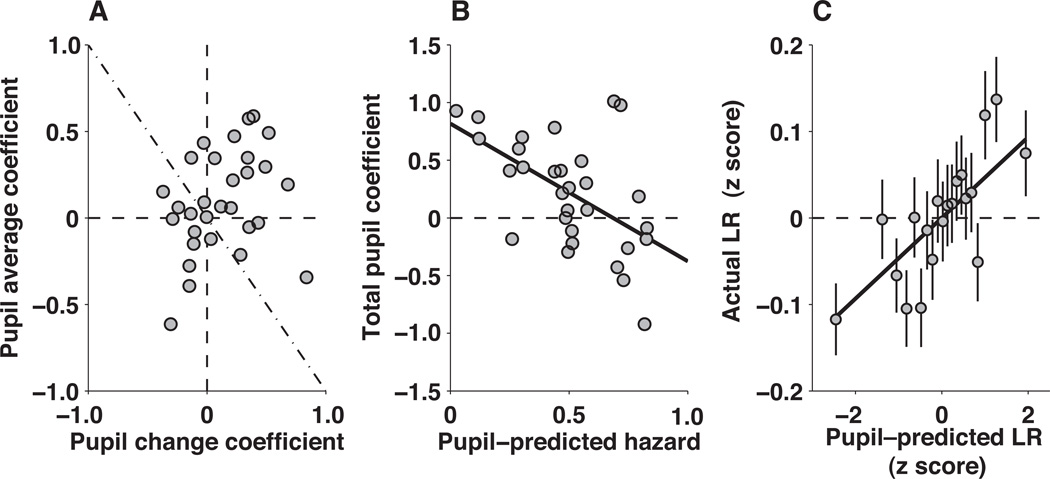
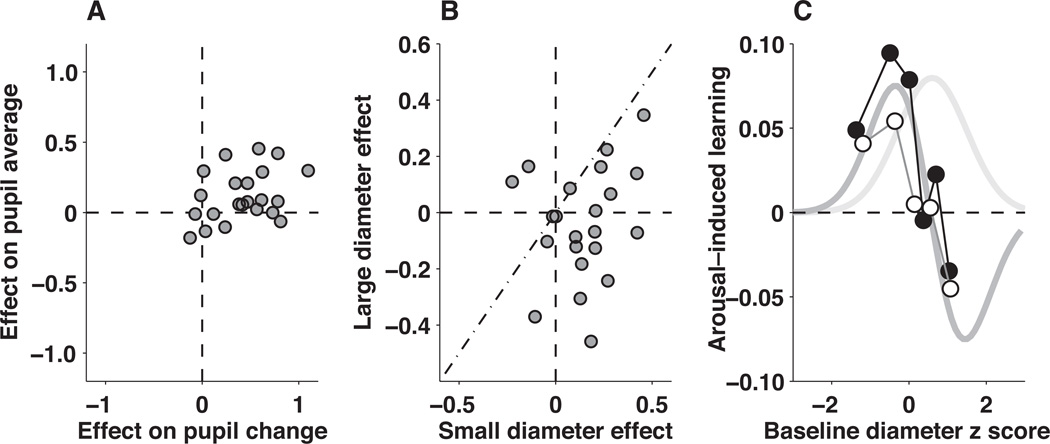
The ability to make inferences about the current state of a dynamic process requires ongoing assessments of the stability and reliability of data generated by that process. We found that these assessments, as defined by a normative model, were reflected in nonluminance-mediated changes in pupil diameter of human subjects performing a predictive-inference task. Brief changes in pupil diameter reflected assessed instabilities in a process that generated noisy data. Baseline pupil diameter reflected the reliability with which recent data indicate the current state of the data-generating process and individual differences in expectations about the rate of instabilities. Together these pupil metrics predicted the influence of new data on subsequent inferences. Moreover, a task- and luminance-independent manipulation of pupil diameter predictably altered the influence of new data. Thus, pupil-linked arousal systems can help to regulate the influence of incoming data on existing beliefs in a dynamic environment.


Figures

Figure 1
Figure 1
Predictive–inference task sequence and pupillometry. Learning rate was computed by dividing the difference in the prediction from one trial to the next by the difference between the current outcome and the current prediction. Inset: mean±SEM pupil diameter, averaged across z–scores computed per subject, aligned to outcome presentation (time=0). Pupil average was computed for each trial as the mean pupil diameter, z–scored by subject, across the entire 2–s fixation window (vertical dashed lines). Pupil change was computed for each trial as the difference in mean diameter, z–scored by subject, measured late (time=1–2s) versus early (time=0–1s) during fixation.
Figure 2
Figure 2
Task performance. A, Learning rates were highest after subjects made larger errors, scaled by noise (as indicated). Points and errorbars are mean±SEM from all subjects. B, Learning rates were highest on change–point trials and decayed thereafter, similarly for both noise conditions. Points and errorbars are mean±SEM from all subjects. C, Learning–rate distributions across all trials from each of the 30 subjects (abscissa), sorted by median learning rate. Horizontal line, box, and whiskers indicate median, 25th/75th percentiles, and 5th/95th percentiles, respectively.
Figure 3
Figure 3
Reduced Bayesian model. A, Learning rate as a function of change–point probability (abscissa) and relative uncertainty (line shading), as computed by the model. B, Change–point probability computed by the model as a function of error magnitude (abscissa) for the two different noise conditions, as indicated, computed for a given relative uncertainty (equal to 0.02 for this figure). C, Mean±SEM relative uncertainty computed by the model aligned to change points from all sequences experienced by the subjects for the two different noise conditions. D, Trial–by–trial comparison of subject and model learning rates. Model learning rates were computed using the same sequence of outcomes experienced by each subject. Points and error bars are mean±SEM data from all subjects grouped into 20 five–percentile bins according to the corresponding model learning rate. The solid line is a linear fit to the unbinned data (r=0.33, p<0.001).
Figure 4
Figure 4
Relationship between pupil change and change–point probability. A, Mean±SEM pupil change from all trials and all subjects for running bins of 150 trials, binned according to the absolute prediction error and sorted by noise, as indicated. B, Regression coefficients describing the linear relationship between change point–probability (pCH) and z–scored pupil change (zpc, ordinate) versus the regression coefficients describing the linear relationship between pCH and z–scored pupil average (zPA, abscissa). Points are regression coefficients computed for each subject individually, using the four–parameter regression model. Arrows indicate mean values from this model (dark, equal to 0.174 zPC/pCH, t-test for H0: mean=0, p<0.001 for the ordinate, −0.022 zPA/pCH, p=0.58 for the abscissa) or from the full model (light, equal to 0.148 zPC/pCH, p<0.001 for the ordinate, −0.014 zPA/pCH, p=0.70 for the abscissa). Dark arrows are partially occluded by light ones. C, Change–point probability from the reduced Bayesian model versus pupil change. Points and error bars are mean±SEM data from all subjects grouped into 20 five–percentile bins. The solid line is a linear fit to the unbinned data (slope = 0.012 pCH/zPC, p<0.001 for H0: slope=0).
Figure 5
Figure 5
Relationship between pupil diameter and relative uncertainty. A, Mean±SEM pupil average from all subjects as a function of trials relative to task change points. Asterisk indicates trials differing significantly from all other trials (permutation test for H0: equal means after correction for multiple comparisons, p<0.05). B, Regression coefficients describing the relationship between relative uncertainty (RU) and z–scored pupil change (zpc, ordinate) versus the regression coefficients describing the relationship between RU and z–scored pupil average (zPA, abscissa). Points are regression coefficients computed for each subject individually, using the four–parameter regression model. Arrows indicate mean values from this model (dark, equal to 0.135 zPC/RU, t-test for H0: mean=0, p=0.28 for the ordinate, 0.35 zPA/RU, p<0.05 for the abscissa) or from the full model (light, equal to 0.127 zPC/RU, p=0.24 for the ordinate, 0.40 zPA/RU, p<0.01 for the abscissa). Dark arrows are partially occluded by light ones. C, Relative uncertainty from the reduced Bayesian model versus pupil average. Points and error bars are mean±SEM data from all subjects grouped into 20 five–percentile bins. The solid line is a linear regression to unbinned data (slope = 0.0055 RU/zPA, p<0.001 for H0: slope=0).
Figure 6
Figure 6
Individual differences in learning rate, hazard rate, and pupil diameter. A, Mean learning rate per subject versus the hazard rate of the reduced Bayesian model that best fit that subject’s performance (points). The solid line is a linear fit (r=0.93, p<0.001). B, Regression coefficients describing the relationship between fit hazard rates and bin–by–bin pupil measurements across subjects, computed in sliding 8.3–ms bins and aligned to outcome presentation (time=0). Dotted lines indicate 95% confidence intervals. C, Relationship between pupil–predicted hazard rate and average learning rate for each subject (points). Pupil–predicted hazard rates were computed using a linear regression model that included both shape and magnitude of the average pupil response for each subject (see Methods). The solid line is a linear fit (r=0.59, p<0.001).
Figure 7
Figure 7
Pupil metrics predict learning rate. A, Regression coefficients describing the linear, trial–by–trial relationships between pupil change and the subsequent learning rate (ordinate) and between pupil average and the subsequent learning rate (abscissa). Points are regression coefficients computed for each subject individually, using a four–parameter regression model that also included trial number and block number as covariates. B, The relationship between learning rate and pupil parameters depended on the subject’s baseline pupil response. For each subject, the sum of the regression coefficients from panel A are plotted as a function of the pupil–predicted hazard rate from Figure 6C. The line is a linear fit (r= −0.059, p<0.001). C, Predicted versus actual learning rate. Both values are z–scored per subject. Data from all subjects are grouped into 20 equally sized bins of predicted learning rate. The line is a linear fit to the unbinned data (Slope = 0.052 zActual/zPredicted, p<0.001 for H0: slope=0).
Figure 8
Figure 8
Effects of the pupil manipulation. A, Evoked changes in pupil diameter. For each subject, pupil average (ordinate) and pupil change (abscissa) were z–scored across all trials. Each point represents the difference in the mean z–scores for auditory switch versus non–switch trials for an individual subject. Positive values indicate larger values on switch trials. B, Evoked changes in learning behavior. For each subject, learning rate was z–scored across all trials and fit to a cumulative Weibull as a function of error magnitude for each noise condition, to account for the relationship shown in Fig. 4A. Each point represents the difference in the mean value of the residuals from these fits for auditory switch versus non–switch trials for an individual subject, separated by trials in which the initial pupil diameter was smaller (ordinate) or larger (abscissa) than its median value. Positive values indicate larger learning rates on auditory switch trials. C, A possible relationship between learning and arousal based on an “inverted U” (light gray, modeled as Gaussian). A given change in learning for a given a change in pupil metrics (ordinate), plotted as a function of baseline pupil diameter (abscissa), is shown for: 1) the hypothesized Gaussian (its derivative is shown in dark gray), 2) the measured effects of the auditory manipulation (open points), and 3) the measured relationship between pupil metrics and learning rate during non-manipulation sessions. See Methods for details.

Comment in

References

    1. Behrens TE, Woolrich MW, Walton ME, Rushworth MF. Learning the value of information in an uncertain world. Nat. Neurosci. 2007;10:1214–1221. - PubMed
    1. Nassar MR, Wilson RC, Heasly B, Gold JI. An approximately Bayesian delta–rule model explains the dynamics of belief updating in a changing environment. J. Neurosci. 2010;30:12366–12378. - PMC - PubMed
    1. Yu AJ, Dayan P. Uncertainty, neuromodulation, and attention. Neuron. 2005;46:681–692. - PubMed
    1. Nieuwenhuis S, De Geus EJ, Aston–Jones G. The anatomical and functional relationship between the P3 and autonomic components of the orienting response. Psychophysiology. 2010 - PMC - PubMed
    1. Aston–Jones G, Cohen JD. An integrative theory of locus coeruleus–norepinephrine function: adaptive gain and optimal performance. Annu. Rev. Neurosci. 2005;28:403–450. - PubMed

Publication types