. 2012 Jun 3;9(7):743-8.
doi: 10.1038/nmeth.2069.

Single-cell systems biology by super-resolution imaging and combinatorial labeling

Affiliations

Single-cell systems biology by super-resolution imaging and combinatorial labeling

Eric Lubeck et al. Nat Methods. .

Abstract

Fluorescence microscopy is a powerful quantitative tool for exploring regulatory networks in single cells. However, the number of molecular species that can be measured simultaneously is limited by the spectral overlap between fluorophores. Here we demonstrate a simple but general strategy to drastically increase the capacity for multiplex detection of molecules in single cells by using optical super-resolution microscopy (SRM) and combinatorial labeling. As a proof of principle, we labeled mRNAs with unique combinations of fluorophores using fluorescence in situ hybridization (FISH), and resolved the sequences and combinations of fluorophores with SRM. We measured mRNA levels of 32 genes simultaneously in single Saccharomyces cerevisiae cells. These experiments demonstrate that combinatorial labeling and super-resolution imaging of single cells is a natural approach to bring systems biology into single cells.


Figures
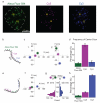
Figure 1
Figure 1
Spatial ordering of fluorophores on mRNAs can be resolved by gaussian centroid localization. (a). Fluorescence images of PUN1 probes hybridized in a single budding yeast cell, shown in each channel. (b). Schematic of labeled 25mer oligonucleotides hybridized to PUN1 mRNA. (c). Reconstructions of the centroids of spots 1 and 2 following localization by Gaussian fitting and image alignment. (d). The percentage of co-localized PUN1 three-color dots that can be reconstructed in the above image (a) with the correct barcode (n=28, Correct Order=74±8%, s.e.m.). (e). Schematic of probe-set hybridized to GFP mRNA with different order and distances between the probes positions. (f). Gaussian fitting reconstruction of this probe set. (g). The distance between the resolved centroids positions (d1=27.93±14 nm, d2= 56±33 nm s.d.) is proportional to the intramolecular distance between barcode positions (190 and 350bp). (h). The frequency of barcode identification for this probe set (n=327, correct order=76±2%, s.e.m.).
Figure 2
Figure 2
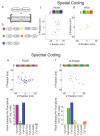
Super-resolution imaging enables combinatorial labeling of individual transcripts. (a). Schematic of super-resolution barcoding scheme. For each super-resolution probe pair, four acceptor-emitter pairs are hybridized in sequence for redundancy. (b). Each barcode color consists of an activator (Alexa Fluor 405, Alexa Fluor 488, and Cy3) labeled oligo adjacent to an emitter (Cy5, Alexa Fluor 680 and Alexa Fluor 750) labeled oligo. (c). PUN1 mRNA 3 position spatial barcode. The order of the probes is shown schematically in the cartoon. A localization scatterplot in which each dot represents an activation of a fluorophore pair is shown. (d). YPS1 mRNA 3 position spatial barcode with 3 different emitters. (e). RCN2 mRNA spectral 3 Position Barcode. Probe Positions are scattered throughout the mRNA, enabling robust hybridization. Bar height in histogram is equal to the number of integrated peak pixel counts detected for each fluorophore pair over time. Cy5-A405, Cy5-A488, Cy5-Cy3 and A750-Cy3 are detected with 6195, 471, 6881 and 235 integrated counts respectively. Cy5-A488 (green and asterisk) is present due to cross-talk from Cy5-Cy3 (blue), and rejected based on the threshold measurements in Supplementary Figs. 10. Note that the A750 based dye pairs give fewer photons than Cy5 dye pairs, but are readily detected with less crosstalk. (f). YLR194c mRNA spectral 3 position barcode. Cy5-A488, Cy5-Cy3, A750-Cy3 and A680-Cy3 are detected with 773, 999, 130 and 92 integrated peak counts. A680-Cy3 (yellow and asterisk) was rejected due to crosstalk from Cy5-Cy3.
Figure 3
Figure 3
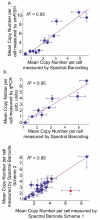
Validation of mRNA quantitation by super-resolution barcoding. (a). Comparison of smFISH results with super-resolution barcodes gives an R2 = 0.95, with a slope of 2.05. 11 genes were FISHed, including 8 crz1 specific genes, 1 Msn2 target gene, and 2 aging and stress genes. (b). For the qPCR experiment, 8 Crz1 genes were quantified. (c). Robustness of mRNA quantitation measured by two different barcode schemes. Mean copy-number measurements for barcoding schemes are displayed as points in the scatterplot. A regression with an R2 value of 0.88 was obtained following removal of the one outlier connoted by a red circle. The outlier was removed due to its high cook’s distance of 2.1 (Supplementary Fig. 12).
Figure 4
Figure 4
Single cell expression profiles of 32 mRNAs. Each column corresponds to the expression profile of a single yeast cell. Cells, and genes in (a) are clustered using agglomerative hierarchal clustering on the correlation between species using Ward’s criterion. The P-values for the secondary clusters are given by bootstrap resampling and placed adjacent to these clusters. (a). Genes responsive to Crz1 and Msn2. Genes can be broadly clustered into two classes, one largely containing genes regulated by both Crz1 and Msn2 (P=0.09, upper cluster) and one largely containing genes regulated by Crz1 (P=0.08, lower cluster). Cells are grouped in two distinct clusters, one showing correlations amongst the expression of all genes regulated by Crz1 (P=0.2, left cluster), the other with large expression correlations amongst combinatorial genes (P=0.16, right clusters). (b). Additional measured genes are shown.
Figure 5
Figure 5
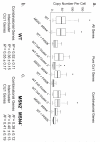
Msn2 and Crz1 combinatorially affect target regulons. All data in this analysis comes from the genes in Fig. 4a, genes displayed in Fig. 4b are not included in these analyses. (a). Total number of regulon-specific mRNAs in single yeast cells shown in box plots. Pure Crz1 targets are expressed in WT and in the Msn2_ and Msn4_ cells, but are repressed in FK506 treated cells. WT cells are clustered into two groups (Fig. 4a), WT Cell Cluster 1 and WT Cell Cluster 2, corresponding to cells with Crz1 or Msn2 pulses respectively. Combinatorial targets are repressed in the Msn2_ and Msn4_ as well as in the FK506 treated cells. (b-c). Averaged correlation coefficients between pairs of genes in the combinatorial or pure Crz1 target clusters. The detailed pairwise gene expression scatter plots are shown in Supplementary Figs. 14,15 .

Comment in

Similar articles

Cited by

References

    1. Johnson DS, Mortazavi A, Myers RM, Wold B. Genome-wide mapping of in vivo protein-DNA interactions. Science. 2007;316:1497–502. - PubMed
    1. Mortazavi A, Williams BA, McCue K, Schaeffer L, Wold B. Mapping and quantifying mammalian transcriptomes by RNA-Seq. Nature methods. 2008;5:621–8. - PubMed
    1. Nagalakshmi U, et al. The transcriptional landscape of the yeast genome defined by RNA sequencing. Science. 2008;320:1344–9. - PMC - PubMed
    1. Schena M, Shalon D, Davis RW, Brown PO. Quantitative Monitoring of Gene Expression Patterns with a Complementary DNA Microarray. Science. 1995;270:467–470. - PubMed
    1. Elowitz MB, Leibler S. A synthetic oscillatory network of transcriptional regulators. Nature. 2000;403:335–8. - PubMed

Publication types

MeSH terms