. 2012 Jun 1;26(11):1209-23.
doi: 10.1101/gad.188037.112.

Coordinated regulation of neuronal mRNA steady-state levels through developmentally controlled intron retention

Affiliations

Coordinated regulation of neuronal mRNA steady-state levels through developmentally controlled intron retention

Karen Yap et al. Genes Dev. .

Abstract

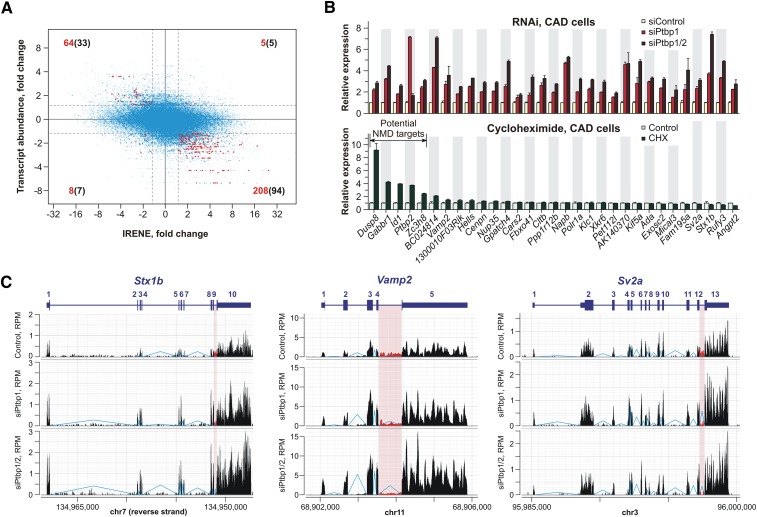
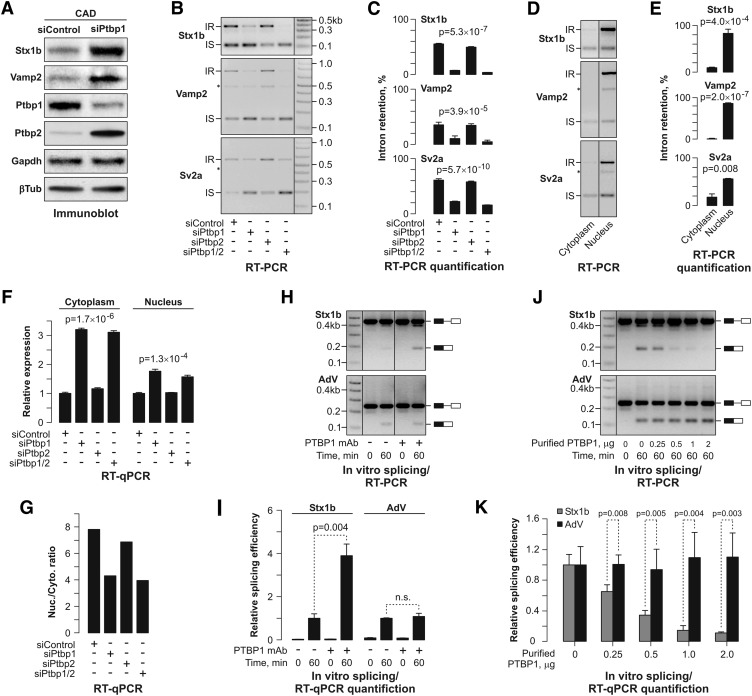
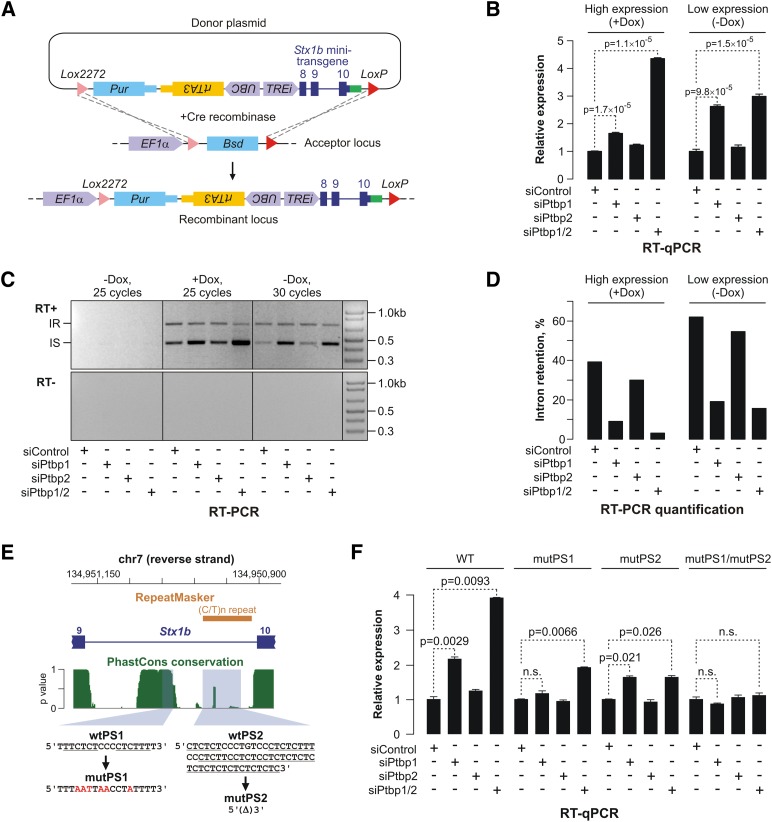
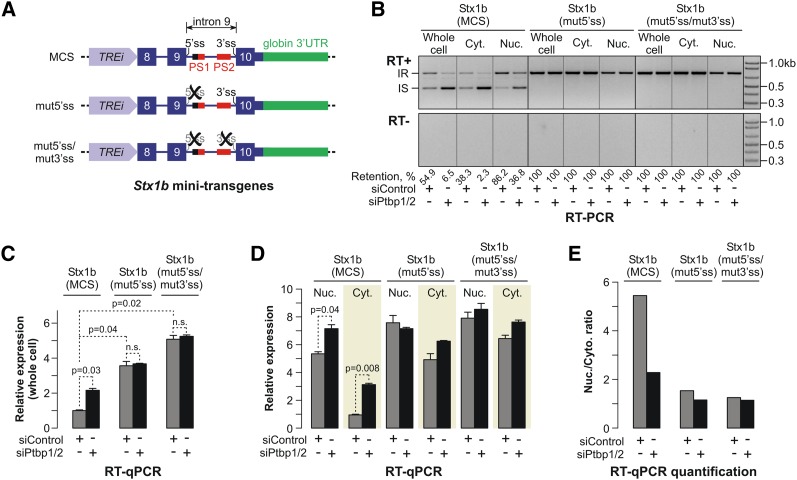
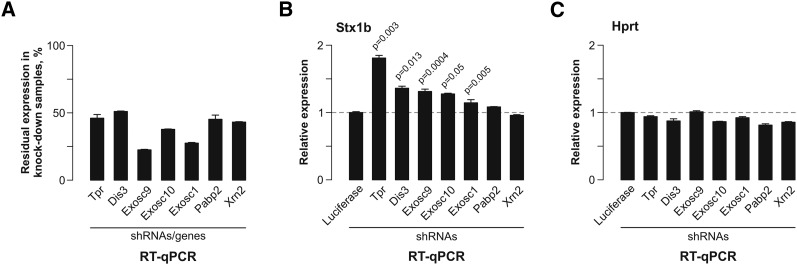
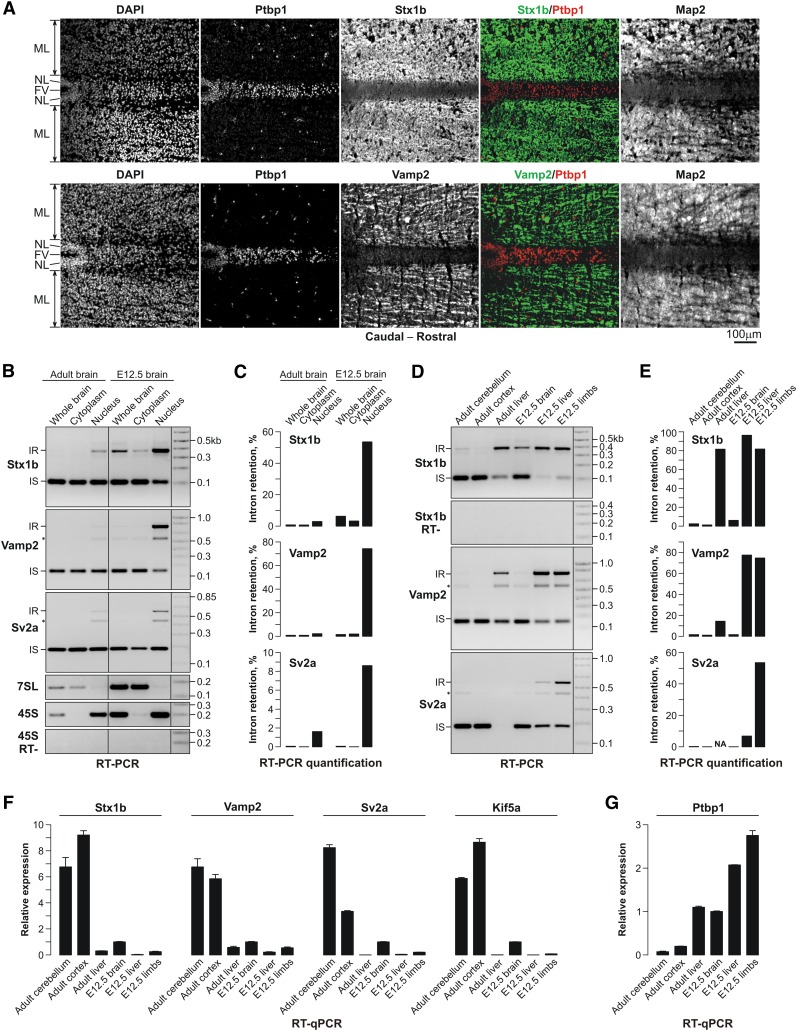
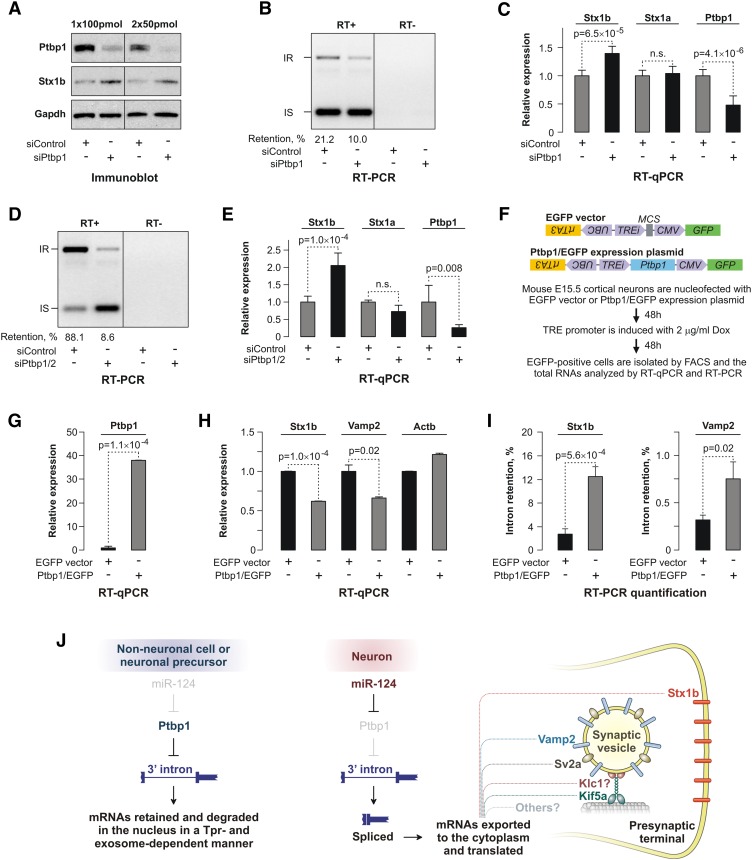
Differentiated cells acquire unique structural and functional traits through coordinated expression of lineage-specific genes. An extensive battery of genes encoding components of the synaptic transmission machinery and specialized cytoskeletal proteins is activated during neurogenesis, but the underlying regulation is not well understood. Here we show that genes encoding critical presynaptic proteins are transcribed at a detectable level in both neurons and nonneuronal cells. However, in nonneuronal cells, the splicing of 3'-terminal introns within these genes is repressed by the polypyrimidine tract-binding protein (Ptbp1). This inhibits the export of incompletely spliced mRNAs to the cytoplasm and triggers their nuclear degradation. Clearance of these intron-containing transcripts occurs independently of the nonsense-mediated decay (NMD) pathway but requires components of the nuclear RNA surveillance machinery, including the nuclear pore-associated protein Tpr and the exosome complex. When Ptbp1 expression decreases during neuronal differentiation, the regulated introns are spliced out, thus allowing the accumulation of translation-competent mRNAs in the cytoplasm. We propose that this mechanism counters ectopic and precocious expression of functionally linked neuron-specific genes and ensures their coherent activation in the appropriate developmental context.


Figures

Figure 1.
Figure 1.
Ptbp1 regulates the expression levels of an extensive set of genes. (A) Relationship between changes in the IRENE values and in the corresponding mRNA expression levels following the Ptbp1 knockdown. (Red) Introns associated with a ≥1.5-fold change in IRENE (P < 0.001) and a simultaneous ≥1.5-fold change in the mRNA abundance (P < 0.001); (blue) the rest of the genes. Numbers of significantly regulated introns within specific quadrants are shown in red, and the corresponding gene numbers are shown in black. (B, top) CAD cells were transfected with Ptbp1-specific siRNA (siPtbp1), an siRNA mixture against both Ptbp1 and Ptbp2 (siPtbp1/2), or a control siRNA (siControl), and the expression levels of 31 genes from the top left quadrant in A were analyzed 72 h post-transfection by RT-qPCR. (Bottom) CAD cells were treated with CHX or DMSO (control), and the expression levels of the same 31 genes were measured using Agilent gene expression microarrays. In both analyses, data were averaged from two to three independent experiments ±SD, and the control expression levels were set to 1. (C) RNA-seq read density plots for the Stx1b, Vamp2, and Sv2a genes. Reads corresponding to the 3′-terminal introns are shown in red.
Figure 2.
Figure 2.
Ptbp1 controls the expression of neuronal genes by repressing splicing of the 3′-terminal introns. (A) Down-regulation of the Ptbp1 protein levels in CAD cells by RNAi elevates the expression of the Stx1b and Vamp2 proteins. The Ptbp1 knockdown efficiency is controlled by Ptbp1- and Ptbp2-specific antibodies. Gapdh and β-tubulin were used as lane loading controls. (B) CAD cells treated with siControl, siPtbp1, siPtbp2, or siPtbp1/2 were analyzed by RT–PCR using primer pairs designed to estimate the splicing efficiency of the 3′-terminal introns. Note that both siPtbp1 and siPtbp1/2 increase the ratio between the intron-spliced (IS) and intron-retained (IR) forms. (C) Quantification of the results in B. Data are averaged from three independent experiments, ±SD. (D) Transcripts retaining the last intron are readily detectable in the nucleus but not in the cytoplasm of the CAD cell. (E) Quantification of the results in D. Data are averaged from three independent experiments, ±SD. (F) Cytoplasmic and nuclear fractions were prepared form CAD cells treated with siRNAs as in B, and the Stx1b expression levels were analyzed by RT-qPCR. (G) Quantification of the RT-qPCR data in F shows that the ratios between the nuclear and the cytoplasmic expression levels of Stx1b, Vamp2, and Sv2a transcripts reduce following Ptbp1 or Ptbp1/2 knockdown. (H,I) Splicing efficiency of a synthetic RNA substrate comprising the wild-type Stx1b exon 9–intron 9–exon 10 segment was assayed in vitro using either control-treated or PTBP1 monoclonal antibody-treated HeLa S3 nuclear extracts, and the reaction products were analyzed by either RT–PCR with a primer pair specific to exons 9 and 10 (H) or RT-qPCR with an exon junction-specific primer pair (I). As expected, no spliced products were detected at the time point 0. Note that the PTBP1 immunodepletion activates Stx1b splicing while having no effect on the splicing efficiency of the control AdV substrate. Data in I are averaged from three amplification experiments (±SD) and compared using the t-test. Splicing efficiencies in the presence of endogenous PTBP1 levels were set to 1. (J) In vitro splicing of the Stx1b and AdV substrates was assayed as in H using PTBP1-immunodepleted nuclear extracts supplemented with the indicated amounts of recombinant PTBP1. Note that the addition of PTBP1 back to the immunodepleted extracts inhibits Stx1b but not AdV splicing. (K) Data from J were averaged from three independent experiments (±SD) and compared using the t-test. Splicing efficiencies in the absence of recombinant PTBP1 were set to 1.
Figure 3.
Figure 3.
Stx1b intron 9 is sufficient and necessary for the Ptbp1-dependent regulation. (A) Integration of the Stx1b minitransgene into the CAD-A13 cell genome using RMCE. (BD) Recombinant CAD-A13 cells containing a single copy of the Stx1b minitransgene were treated with the indicated siRNAs for 48 h, followed by 24-h incubation with or without Dox. (B) RT-qPCR analysis showing that the minitransgene expression levels increase following the Ptbp1 or the double Ptbp1/2 knockdown. (C, top) The splicing status of the transgenic intron 9 was assayed by RT–PCR. (Bottom) No PCR signal was detected when reverse transcriptase was omitted from the RT reactions. (D) Quantification of the data in C indicates that a large fraction of transgenic transcripts retain intron 9 in siControl- and siPtbp2-treated samples, whereas siPtbp1 and siPtbp1/2 dramatically stimulate the intron splicing. (E) Diagram of the exon 9–intron 9–exon 10 fragment of the mouse Stx1b gene. The phastCons plot (green) shows the probability of sequence conservation across placental mammalian species (Siepel et al. 2005). Note that a fragment of intron 9 is conserved across species. The orange rectangle marks the position of a poorly conserved (C/T)n repeat predicted by RepeatMasker (http://www.repeatmasker.org). The wild-type PS1 and PS2 sequences containing consensus Ptbp1-binding sites (underlined) and the corresponding mutations are indicated at the bottom. (F) Recombinant CAD-A13 cells containing a single copy of either the wild-type minitransgene or minitransgenes containing the PS1 and/or PS2 mutations were treated with the indicated siRNAs for 72 h, and the expression levels of the transgenic transcripts were analyzed by RT-qPCR. Note that the individual mutations reduce the minitransgene response to the Ptbp1 or the Ptbp1/2 knockdown, whereas the PS1/PS2 double mutation completely abolishes the regulation. Data in B and F are averaged from three experiments, ±SD.
Figure 4.
Figure 4.
Intron 9 recognition by the splicing machinery is necessary for the Ptbp1-dependent regulation of Stx1b mRNA abundance. (A) Diagram of the Stx1b minitransgenes. (B, top) CAD-A13 cells containing the transgenes depicted in A were treated with either siControl or siPtbp1/2 for 72 h, and the total RNAs from the whole cells or the two subcellular fractions were analyzed by RT–PCR to examine the transgenic intron 9 splicing. (Bottom) No PCR products were detected in the absence of reverse transcriptase. (C) RT-qPCR analysis showing that the mutation of either 5′ss or both 5′ss and 3′ss significantly increases the transgene expression levels in the siControl-treated cells. Moreover, unlike Stx1b(MCS), the expression of Stx1b(mut5′ss) and Stx1b(mut5′ss/mut3′ss) minitransgenes is not activated by siPtbp1/2. (D) RT-qPCR analysis showing that siPtbp1/2 stimulates the expression levels of Stx1b(MCS) but not Stx1b(mut5′ss) or Stx1b(mut5′ss/mut3′ss) in the nucleus and the cytoplasm. (E) Quantification of the RT-qPCR data in D suggesting that the siPtbp1/2 treatment also reduces the originally high ratio between the nuclear and cytoplasmic levels of Stx1b(MCS) but not Stx1b(mut5′ss) and Stx1b(mut5′ss/mut3′ss) transcripts.
Figure 5.
Figure 5.
Nuclear RNA surveillance machinery is involved in the Stx1b regulation. (A) CAD-A13 cells encoding stably integrated shRNAs under the control of a Dox-inducible promoter (Khandelia et al. 2011) were treated with 2 μg/mL Dox for 72 h, and the knockdown efficiencies were analyzed by RT-qPCR. Shown are residual mRNA expression levels normalized to the expression of the corresponding mRNAs in the presence of a firefly luciferase-specific shRNA control. Values are averaged from three amplification experiments, ±SD. Note that in all five cases, mRNA expression is noticeably diminished by the gene-specific shRNAs. (B) Stx1b mRNA expression levels were assayed by RT-qPCR following the knockdown of the indicated components of the RNA surveillance machinery. Note that shRNA specific to the nuclear pore-associated protein Tpr and the exosome subunit Dis3 leads to statistically significant accumulation of the Stx1b mRNA. (C) None of the shRNAs tested in this experiment led to significant up-regulation of the control Hprt mRNA. In B and C, the P-values were calculated using a two-tailed t-test assuming unequal variances and shown only for the samples showing significant (P ≤ 0.05) up-regulation of mRNA expression in response to shRNA treatment as compared with the luciferase shRNA control. Data are normalized to the expression levels of Gapdh mRNA and are averaged from at least three amplification experiments, ±SD.
Figure 6.
Figure 6.
Ptbp1 expression pattern is consistent with its role as a regulator of presynaptic genes in vivo. (A) Immunofluorescence analyses of E13.5 medulla sections of the hind brain show that the Ptbp1 protein is expressed in the NSC-containing neuroepithelial layer (NL) lining the fourth ventricle (FV) but not in the mantle layer (ML) containing neurons at different stages of differentiation. Stx1b and Vamp2 proteins are expressed in a strictly reciprocal manner. The sections are additionally stained with antibodies against Map2, a marker of mature neurons. (B) Total RNAs were purified from the entire adult and E12.5 embryonic mouse brains or the corresponding cytoplasmic and nuclear fractions, and the Stx1b, Vamp2, and Sv2a 3′-terminal intron splicing was analyzed by RT–PCR. Nuclear (45S pre-rRNA) and cytoplasmic (7SL) RNA markers were analyzed by RT–PCR to confirm the nucleocytoplasmic fractionation quality. (C) Quantification of the results in B. (D,E) The analyses in B and C were repeated for six adult and embryonic tissue samples. (F,G) RT-qPCR analyses of Stx1b, Vamp2, Sv2a, Kif5a, and Ptbp1 expression in vivo.
Figure 7.
Figure 7.
Ptbp1 regulates the Stx1b expression in NSCs and nonneuronal cells. (A) Neurosphere cultures were nucleofected once with 100 pmol or twice with 50 pmol of either siControl or siPtbp1, and the expression of the Ptbp1 and Stx1b proteins was analyzed by immunoblotting. The Stx1b expression increased noticeably following the Ptbp1 knockdown. (B,C) The neurosphere cultures nucleofected once with 100 pmol of siRNAs were additionally analyzed by RT–PCR to examine the Stx1b intron 9 splicing status (B) and RT-qPCR to assess the Stx1b expression levels (C). (D,E) PMEFs were transfected with siControl or siPtbp1/2 and analyzed by RT–PCR and RT-qPCR as in B and C. (F, top) EGFP and Ptbp1/EGFP expression plasmid used in nucleofection experiments. (Bottom) A flow chart of the experiment carried out to examine the effect of Ptbp1 overexpression in primary cortical neurons. (G) RT-qPCR analysis confirming that Ptbp1/EGFP-nucleofected neurons express larger amounts of Ptbp1 mRNA than their EGFP-only counterparts. (H) RT-qPCR analysis showing that neurons overexpressing Ptbp1 express significantly less Stx1b and Vamp2 mRNA. (I) Quantification of RT–PCR analyses carried out as in B and D, demonstrating significantly elevated retention of the Stx1b- and Vamp2-regulated introns in the presence of Ptbp1. Data in C, E, and G–I are averaged from at least three independent amplification experiments (±SD) and compared using the t-test. (J) Model for coordinated regulation of presynaptic genes through Ptbp1-controlled splicing of the 3′-terminal introns.

References

    1. Ameur A, Zaghlool A, Halvardson J, Wetterbom A, Gyllensten U, Cavelier L, Feuk L 2011. Total RNA sequencing reveals nascent transcription and widespread co-transcriptional splicing in the human brain. Nat Struct Mol Biol 18: 1435–1440 - PubMed
    1. Averbeck N, Sunder S, Sample N, Wise JA, Leatherwood J 2005. Negative control contributes to an extensive program of meiotic splicing in fission yeast. Mol Cell 18: 491–498 - PubMed
    1. Ballas N, Mandel G 2005. The many faces of REST oversee epigenetic programming of neuronal genes. Curr Opin Neurobiol 15: 500–506 - PubMed
    1. Barash Y, Calarco JA, Gao W, Pan Q, Wang X, Shai O, Blencowe BJ, Frey BJ 2010. Deciphering the splicing code. Nature 465: 53–59 - PubMed
    1. Bell TJ, Miyashiro KY, Sul JY, Buckley PT, Lee MT, McCullough R, Jochems J, Kim J, Cantor CR, Parsons TD, et al. 2010. Intron retention facilitates splice variant diversity in calcium-activated big potassium channel populations. Proc Natl Acad Sci 107: 21152–21157 - PMC - PubMed

Publication types

MeSH terms