. 2012 Jun 1;26(11):1247-62.
doi: 10.1101/gad.193565.112.

Platelet-derived growth factor receptors differentially inform intertumoral and intratumoral heterogeneity

Affiliations

Platelet-derived growth factor receptors differentially inform intertumoral and intratumoral heterogeneity

Youngmi Kim et al. Genes Dev. .

Abstract

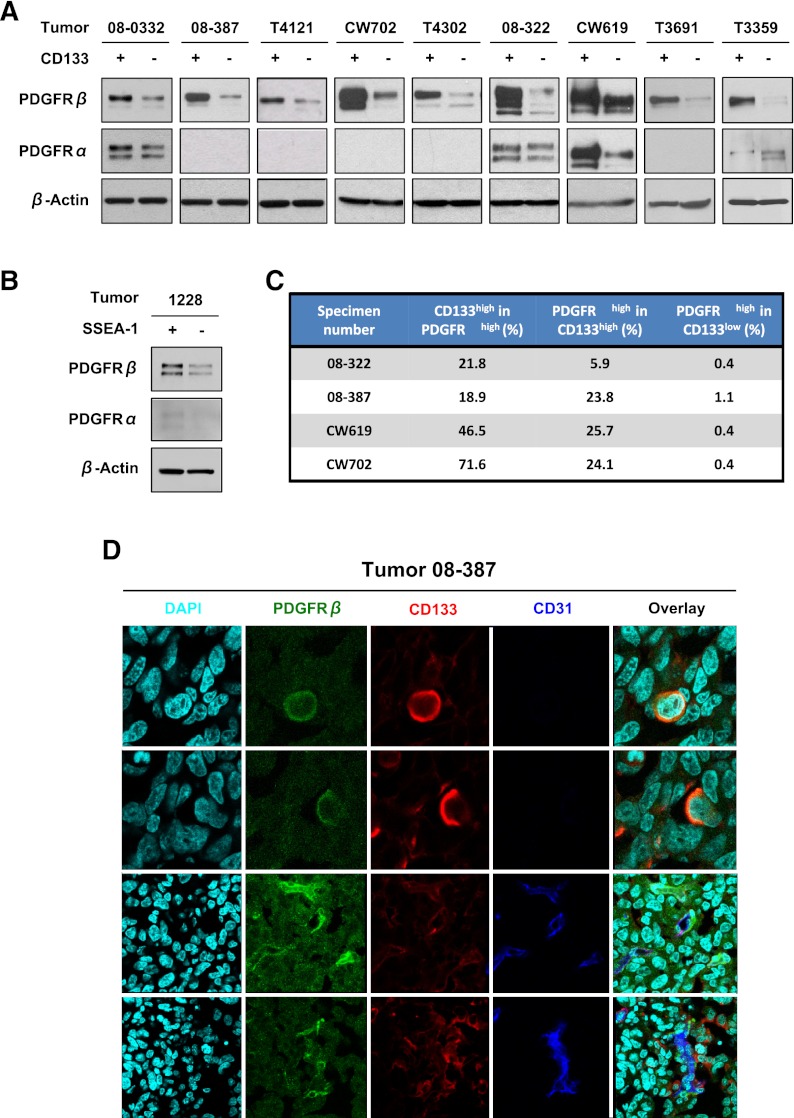
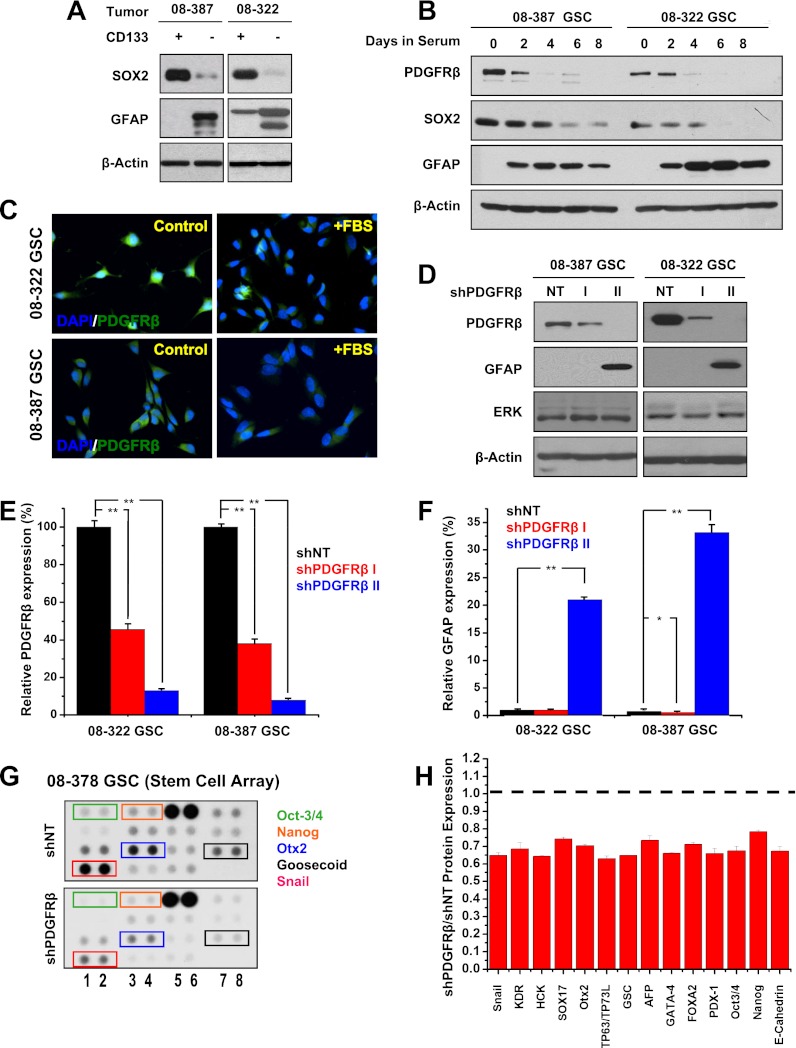
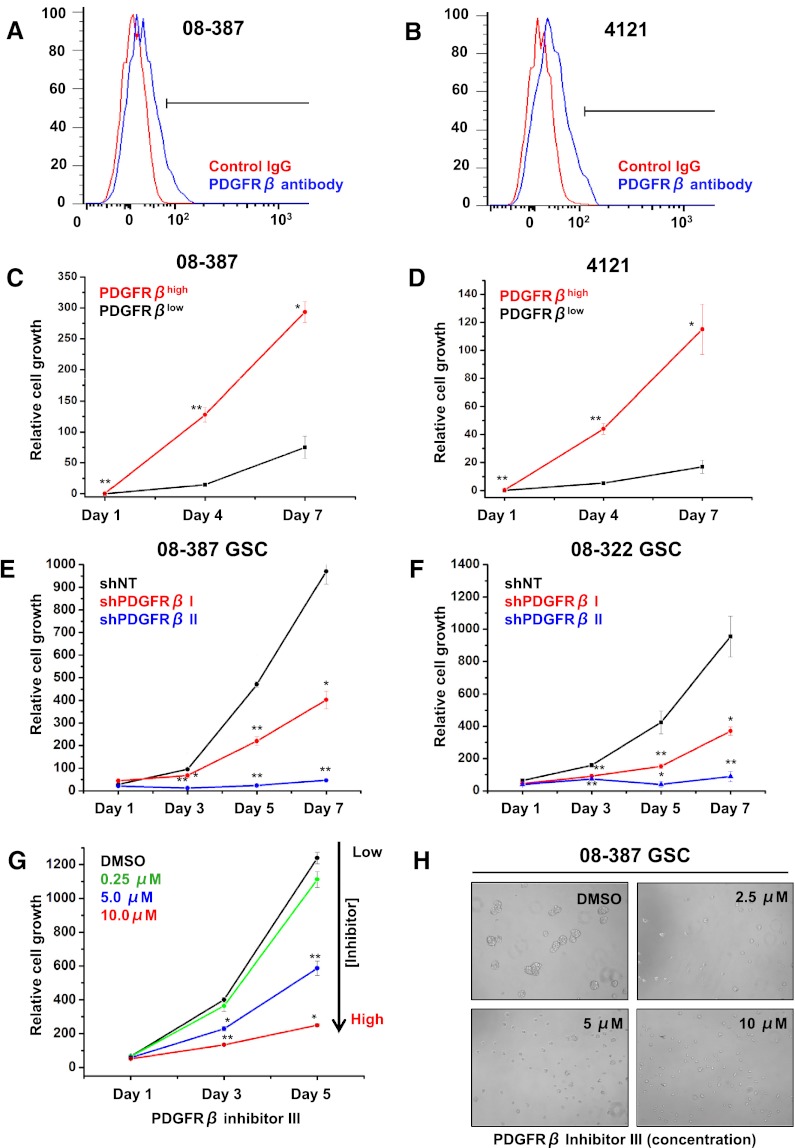
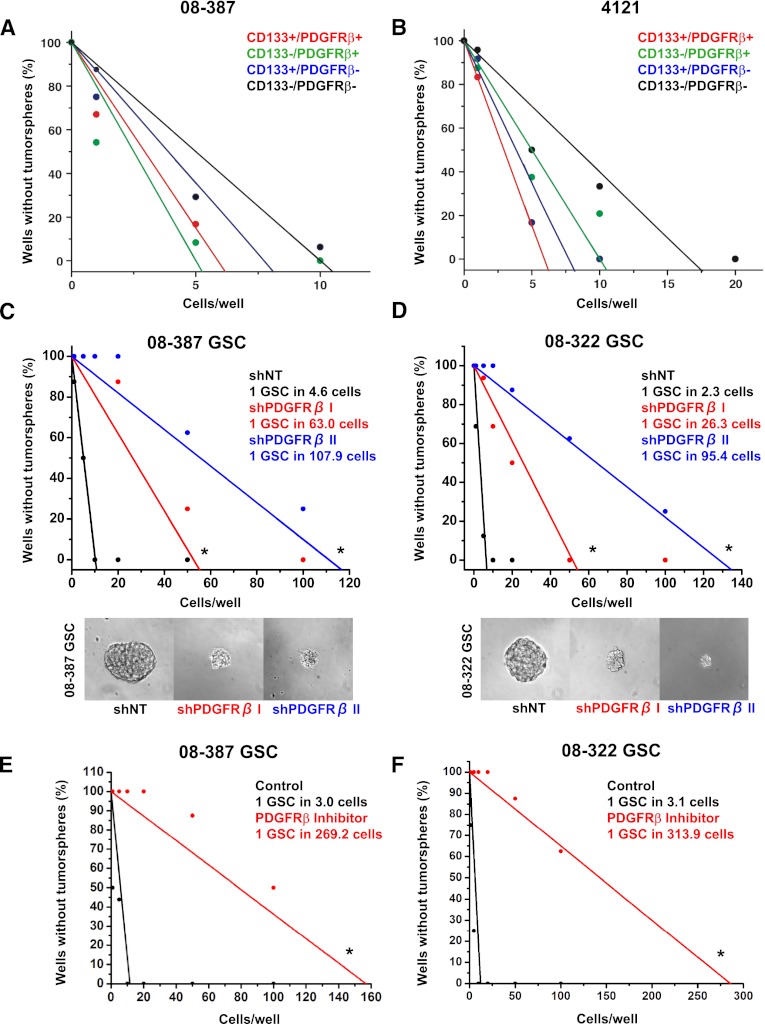
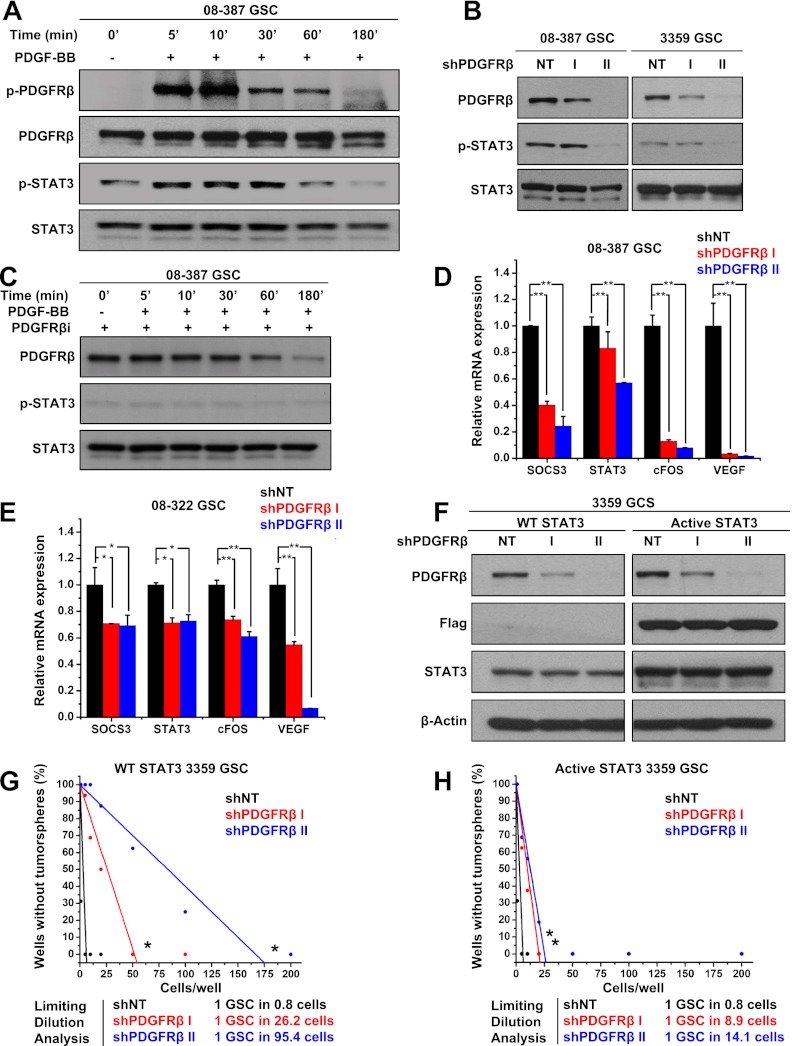
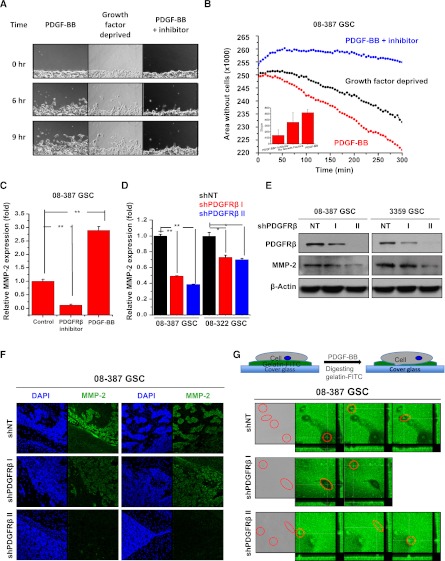
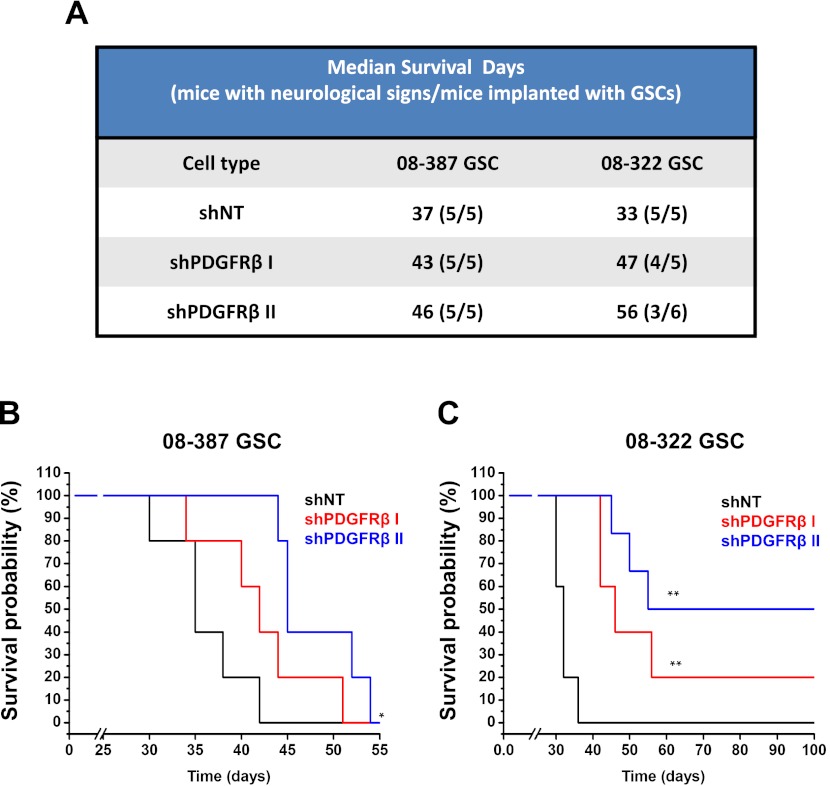
Growth factor-mediated proliferation and self-renewal maintain tissue-specific stem cells and are frequently dysregulated in cancers. Platelet-derived growth factor (PDGF) ligands and receptors (PDGFRs) are commonly overexpressed in gliomas and initiate tumors, as proven in genetically engineered models. While PDGFRα alterations inform intertumoral heterogeneity toward a proneural glioblastoma (GBM) subtype, we interrogated the role of PDGFRs in intratumoral GBM heterogeneity. We found that PDGFRα is expressed only in a subset of GBMs, while PDGFRβ is more commonly expressed in tumors but is preferentially expressed by self-renewing tumorigenic GBM stem cells (GSCs). Genetic or pharmacological targeting of PDGFRβ (but not PDGFRα) attenuated GSC self-renewal, survival, tumor growth, and invasion. PDGFRβ inhibition decreased activation of the cancer stem cell signaling node STAT3, while constitutively active STAT3 rescued the loss of GSC self-renewal caused by PDGFRβ targeting. In silico survival analysis demonstrated that PDGFRB informed poor prognosis, while PDGFRA was a positive prognostic factor. Our results may explain mixed clinical responses of anti-PDGFR-based approaches and suggest the need for integration of models of cancer as an organ system into development of cancer therapies.


Figures

Figure 1.
Figure 1.
PDGFRβ is elevated in GSCs. Immunoblotting assay comparing PDGFRα and PDGFRβ expression in GSCs and GBM nonstem cells sorted using CD133 (A) and CD15 (B) antibodies reveals increased PDGFRβ in the GSC fraction. (C) Summary of fluorescence-activated cell sorting (FACS) analysis demonstrating coexpression of PDGFRβ and CD133. (D) Immunofluorescence staining of PDGFRβ and CD133 antibodies in glioma specimens demonstrates coexpression. PDGFRβ-positive cells are green, CD133 cells are red, and CD31 cells are blue.
Figure 2.
Figure 2.
PDGFRβ and GSC marker expression correlate. (A) Sox2 and GFAP protein expression in GSCs and GBM nonstem cells determined via Western confirmed differences in the expression of these stem and differentiation markers. (B) PDGFRβ, Sox2, and GFAP expression monitored using Western after FBS addition demonstrated PDGFRβ and Sox2 decreased while GFAP increased with differentiation. (C) Immunofluorescence demonstrated that PDGFRβ expression decreased after differentiation. (D) PDGFRβ knockdown was confirmed via Western after introduction of two different PDGFRβ shRNAs (shPDGFRβ I and shPDGFRβ II) in comparison with nontargeting (NT) control. PDGFRβ knockdown associated with increased GFAP expression. (E) Efficiency of PDGFRβ knockdown was quantitatively measured by real-time PCR after exposure to lentivirus expressing shPDGFRβ I, shPDGFRβ II, or a nontargeting control shRNA (shNT). (F) Real-time PCR demonstrated increased expression of the astrocyte differentiation marker GFAP in cells with shPDGFRβ II. (G) Representative image of stem cell arrays after exposure to lysate from GSCs expressing nontargeting shRNA (shNT) or shPDGFRβ demonstrating decreased levels of many stem factors after PDGFRβ knockdown. (H) Quantification of the relative expression of stem cell factors in shPDGFRβ versus nontargeting shRNA (shNT).
Figure 3.
Figure 3.
PDGFRβ promotes GSC growth. Representative FACS plots of 08-387 (A) and 4121 (B) cells demonstrating isolation of PDGFRβhigh cells. Growth of PDGFRβhigh and PDGFRβlow cells isolated via FACS from 08-387 (C) or 4121 (D) cells over time was measured using adenosine triphosphate (ATP) content in accordance with the cell titer assay. PDGFRβhigh cells grow faster than PDGFRβlow cells. Growth of 08-387 (E) or 08-322 (F) GSCs expressing two different shRNAs directed against PDGFRβ (shPDGFRβ I and shPDGFRβ II) was lower than GSCs expressing nontargeting shRNA (shNT) as measured over time using the cell titer assay. (G) Growth of GSCs exposed to increasing concentrations of PDGFRβ inhibitor III was decreased in the cell titer assay. (H) Representative images of GSCs exposed to increasing concentrations of PDGFRβ inhibitor III.
Figure 4.
Figure 4.
PDGFRβ regulates GSC survival. Cell cycle analysis of EdU-labeled 08-387 (A) and 08-322 (B) GSCs expressing nontargeting shRNA (shNT) or two different shRNAs directed against shPDGFRβ (shPDGFRβ I and shPDGFRβ II) shows that the percentage of S-phase cells is decreased and the percentage of sub-G1 cells increased with shPDGFRβ. (C) Representative images of EdU-positive cells (red) with a DAPI costain (blue). The percentage of apoptotic cells in 08-387 (D) and 08-322 (E) GSCs was increased with shPDGFRβ in the TUNEL assay. (F) Representative images of TUNEL-positive cells (red) with a DAPI costain (blue).
Figure 5.
Figure 5.
Genetic or pharmacological targeting of PDGFRβ decreases tumorsphere formation. In vitro limiting dilution assay with 08-387 (A) and 4121 (B) demonstrated that higher PDGFRβ expression led to increasing tumorsphere formation when CD133 was used as a GSC marker. In vitro limiting dilution assays with 08-387 (C) and 08-322 (D) GSCs expressing nontargeting shRNA (shNT) or two different shRNAs directed against shPDGFRβ (shPDGFRβ I and shPDGFRβ II) demonstrated that tumorsphere formation decreases with shPDGFRβ. The tumorsphere formation capacity of 08-387 (E) and 08-322 (F) GSCs is decreased with PDGFRβ Inhibitor III treatment in the in vitro limiting dilution assay. Limiting dilution analyses were performed using Extreme Limiting Dilution Analysis (http://bioinf.wehi.edu.au/software/elda). (*) P < 0.0001.
Figure 6.
Figure 6.
PDGFRβ activates STAT3 to promote GSC tumorsphere formation capacity. (A) PDGF-BB induced activation of PDGFRβ and STAT3 in GSCs, as demonstrated with phopho-specific antibodies via Western. (B) Immunoblotting showed decreased phospho-STAT3 in cells expressing shRNA directed against PDGFRβ (shPDGFRβ) in comparison with a nontargeting control shRNA (NT). (C) Western analysis demonstrated that PDGFRβ inhibitor prevented PDGF-BB-induced phosphorylation of STAT3. mRNA expression of STAT3 target genes was decreased in 08-387 (D) or 08-322 (E) GSCs expressing shPDGFRβ in comparison with nontargeting control shRNA (shNT). (F) Immunoblotting showed successful knockdown of shPDGFRβ in comparison with nontargeting control shRNA (shNT) in GSCs expressing GFP (Control) or a constitutively active Flag-tagged STAT3 (Active STAT3). The in vitro limiting dilution assay with control GSCs (G) or GSCs expressing constitutively active STAT3 (H) demonstrated that activated STAT3 could compensate for the knockdown of PDGFRβ by restoring the ability of GSCs to form tumorspheres. Limiting dilution analyses were performed using Extreme Limiting Dilution Analysis (http://bioinf.wehi.edu.au/software/elda). (*) P < 0.0001.
Figure 7.
Figure 7.
GSC migration and invasion is dependent on PDGFRβ. (A) Representative images of GSCs in the scratch assay. (B) Calculation of the area remaining without cells in the scratch assay demonstrated that GSCs migrated in response to PDGF-BB treatment and that this movement was prevented by PDGFRβ inhibitor. (C) Quantitative real-time PCR demonstrated that MMP-2 mRNA was increased by PDGF-BB and reduced by PDGFRβ inhibitor in GSCs. (D) Quantitative real-time PCR demonstrated that MMP-2 mRNA was decreased in GSCs expressing shPDGFRβ in comparison with a nontargeting control shRNA (shNT). (E) Immunoblotting showed decreased MMP-2 expression in cells expressing shRNA directed against PDGFRβ (shPDGFRβ) in comparison with a nontargeting control shRNA (NT). (F) Representative immunofluorescent images of sections of glioma xenografts showed that GSCs treated with shPDGFRβ had reduced levels of MMP-2 and were unable to form invasive islets in vivo. (G) Activity of MMPs as determined by loss of fluorescence from FITC-gelatin was decreased in GSCs expressing shPDGFRβ in comparison with nontargeting control shRNA (shNT).
Figure 8.
Figure 8.
PDGFRβ promotes GSC in vivo tumor propagation. (A) The median survival and number of tumors formed are shown for 08-387 and 08-322 GSCs expressing nontargeting shRNA (shNT) or shRNA directed against PDGFRβ (shPDGFRβ I and shPDGFRβ II). Kaplan-Meier survival curves for 08-387 (B) and 08-322 (C) GSCs expressing nontargeting shRNA (shNT) or shPDGFRβ demonstrate delayed tumor growth with shPDGFRβ.

References

    1. Assanah MC, Bruce JN, Suzuki SO, Chen A, Goldman JE, Canoll P 2009. PDGF stimulates the massive expansion of glial progenitors in the neonatal forebrain. Glia 57: 1835–1847 - PubMed
    1. Bao S, Wu Q, Sathornsumetee S, Hao Y, Li Z, Hjelmeland AB, Shi Q, McLendon RE, Bigner DD, Rich JN 2006. Stem cell-like glioma cells promote tumor angiogenesis through vascular endothelial growth factor. Cancer Res 66: 7843–7848 - PubMed
    1. Calabrese C, Poppleton H, Kocak M, Hogg TL, Fuller C, Hamner B, Oh EY, Gaber MW, Finklestein D, Allen M, et al. 2007. A perivascular niche for brain tumor stem cells. Cancer Cell 11: 69–82 - PubMed
    1. The Cancer Genome Atlas Research Network 2008. Comprehensive genomic characterization defines human glioblastoma genes and core pathways. Nature 455: 1061–1068 - PMC - PubMed
    1. Cao Y, Lathia JD, Eyler CE, Wu Q, Li Z, Wang H, McLendon RE, Hjelmeland AB, Rich JN 2010. Erythropoietin receptor signaling through STAT3 is required for glioma stem cell maintenance. Genes Cancer 1: 50–61 - PMC - PubMed

Publication types

MeSH terms

Substances