. 2012 Mar;6(1):12804-128049.
doi: 10.1063/1.3672188. Epub 2012 Mar 15.

Development and validation of a low cost blood filtration element separating plasma from undiluted whole blood

Development and validation of a low cost blood filtration element separating plasma from undiluted whole blood

Alexandra Homsy et al. Biomicrofluidics. 2012 Mar.

Abstract

Clinical point of care testing often needs plasma instead of whole blood. As centrifugation is labor intensive and not always accessible, filtration is a more appropriate separation technique. The complexity of whole blood is such that there is still no commercially available filtration system capable of separating small sample volumes (10-100 μl) at the point of care. The microfluidics research in blood filtration is very active but to date nobody has validated a low cost device that simultaneously filtrates small samples of whole blood and reproducibly recovers clinically relevant biomarkers, and all this in a limited amount of time with undiluted raw samples. In this paper, we show first that plasma filtration from undiluted whole blood is feasible and reproducible in a low-cost microfluidic device. This novel microfluidic blood filtration element (BFE) extracts 12 μl of plasma from 100 μl of whole blood in less than 10 min. Then, we demonstrate that our device is valid for clinical studies by measuring the adsorption of interleukins through our system. This adsorption is reproducible for interleukins IL6, IL8, and IL10 but not for TNFα. Hence, our BFE is valid for clinical diagnostics with simple calibration prior to performing any measurement.


Figures

Figure 1
Figure 1
Schematic representation and photograph of the BFE. (a) Exploded 3D view. Microchannels (yellow): molded in UV Glue; coverplate (transparent-white): milled in polycarbonate; filter membrane (red): Pall “Vivid Plasma Separation” membrane. (b) Cross-sectional view of the BFE. (c) Design of the microfluidic part: the parallel capillaries are 50 μm wide, 20 μm deep, and 300 μm apart. The collection microchannel is 450 μm wide and 150 μm deep. The total volume of the collection microchannel is 17 μl. (d) Top view of the BFE: the venting inlet and plasma outlet allow easy connection to standard 1/4-28 UNF fittings. The venting inlet allows flushing of the filtered plasma at the end of the experiment.
Figure 2
Figure 2
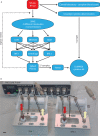
Interleukin adsorption study. (a) Flow chart of the experimental conditions: whole blood from each human subject is simultaneously centrifuged and filtered through two BFE in parallel. The interleukin content of the resulting plasma is analyzed with the standard Luminex device. (b) Two BFEs are enclosed in chip holders for good sealing. BFE 1 and BFE 2 are tested in parallel during the study. The red arrows show where blood samples are introduced before the pressure pump is connected to accelerate plasma extraction. The yellow arrows indicate the plasma outlet port. Three channels (P1–P3) of the pressure pump are connected to BFE 1, and three other channels (P4–P6) are connected to BFE 2. Each channel allows for the setting of a different pressure value, the pump’s software enables the automation of the pressure control during the experiment. In this particular experiment, P1 = P4, P2 = P5, and P3 = P6. The scale bar denotes 10 mm.
Figure 3
Figure 3
Recovery rate of plasma filtered through our BFE. The whole blood was donated by three different human subjects. The plasma was studied and analyzed following the procedure described in Fig. 2. The interleukin concentrations are detailed in Table TABLE I.. Recovery was calculated using Eq. 1. The error on the measurements is detailed in Table TABLE III..

References

    1. Toner M. and Irimia D., Annu. Rev. Biomed. Eng. 7, 77 (2005).10.1146/annurev.bioeng.7.011205.135108 - DOI - PMC - PubMed
    1. Kemmler M., Koger B., Sulz G., Sauer U., Schleicher E., Preininger C., and Brandenburg A., Sens. Actuators B 139, 44 (2009).10.1016/j.snb.2008.08.043 - DOI
    1. Yager P., Edwards T., Fu E., Helton K., Nelson K., Tam M. R., and Weigl B. H., Nature 442, 412 (2006).10.1038/nature05064 - DOI - PubMed
    1. Li N., Kamei D. T., and Ho C.-M., in Proceedings of the 2nd IEEE Conference on Nano/Micro Engineered and Molecular Systems, Bangkok, Thailand, January 16–19, 2007.
    1. Lenshof A., Ahmad-Tajudin A., Järås K., Swärd-Nilsson A.-M., Åberg L., Marko-Varga G., Malm J., Lilja H., and Laurell T., Anal. Chem. 81, 6030 (2009).10.1021/ac9013572 - DOI - PubMed

LinkOut - more resources