

A stochastic description of Dictyostelium chemotaxis
- PMID: 22662138
- PMCID: PMC3360683
- DOI: 10.1371/journal.pone.0037213
A stochastic description of Dictyostelium chemotaxis
Abstract
Chemotaxis, the directed motion of a cell toward a chemical source, plays a key role in many essential biological processes. Here, we derive a statistical model that quantitatively describes the chemotactic motion of eukaryotic cells in a chemical gradient. Our model is based on observations of the chemotactic motion of the social ameba Dictyostelium discoideum, a model organism for eukaryotic chemotaxis. A large number of cell trajectories in stationary, linear chemoattractant gradients is measured, using microfluidic tools in combination with automated cell tracking. We describe the directional motion as the interplay between deterministic and stochastic contributions based on a Langevin equation. The functional form of this equation is directly extracted from experimental data by angle-resolved conditional averages. It contains quadratic deterministic damping and multiplicative noise. In the presence of an external gradient, the deterministic part shows a clear angular dependence that takes the form of a force pointing in gradient direction. With increasing gradient steepness, this force passes through a maximum that coincides with maxima in both speed and directionality of the cells. The stochastic part, on the other hand, does not depend on the orientation of the directional cue and remains independent of the gradient magnitude. Numerical simulations of our probabilistic model yield quantitative agreement with the experimental distribution functions. Thus our model captures well the dynamics of chemotactic cells and can serve to quantify differences and similarities of different chemotactic eukaryotes. Finally, on the basis of our model, we can characterize the heterogeneity within a population of chemotactic cells.
Conflict of interest statement
Figures
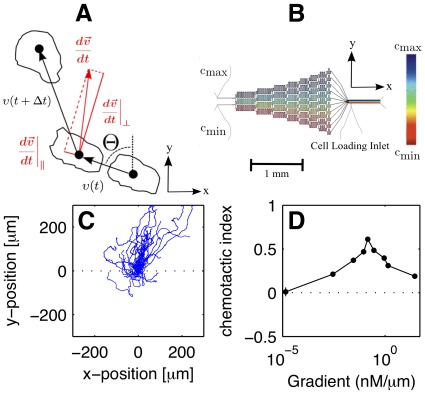
 m cAMP. The starting point of all trajectories was shifted to (0,0). (D) Average chemotactic index as a function of the cAMP gradient. Note that the data point displayed at very low gradient values (
 nM/
nM/ m) corresponds to an experiment where no gradient of cAMP was applied.
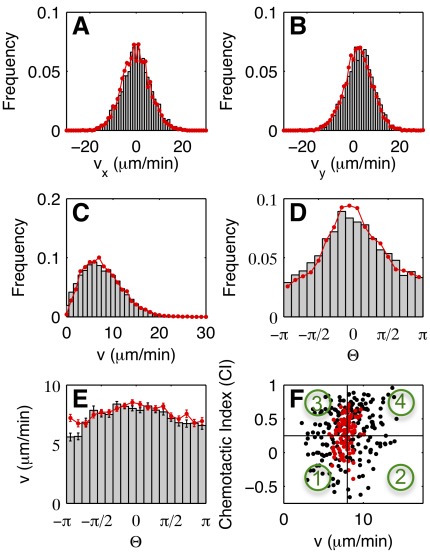
 , (B)
, (B)  , (C)
, (C)  , and (D)
  . (E) Experimental (gray boxes) and numerical (red line) distributions of
  as a function of
  . (F) Each dot marks a cells according to its mean speed and chemotactic index in the (
 ,CI)-plane. Black symbols mark the experimental data, red dots the numerical results. The vertical and horizontal lines indicate the mean speed and chemotactic index of the entire population as obtained from the experiment. The numbers mark the subpopulations defined by the four quadrants. They are differentiated according to their directionality and speed, (1) slow non-chemotactic, (2) fast non-chemotactic, (3) slow chemotactic, and (4) fast chemotactic cells.
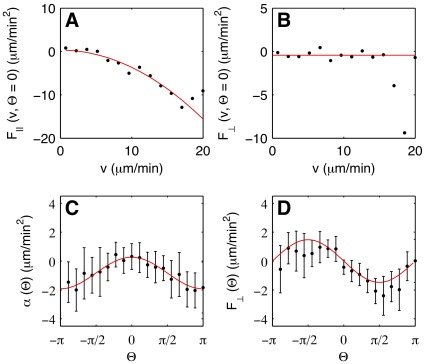
 (gradient direction), as a function of
  . Black dots show the experimental results, the red lines display fits according to
  and
and  , respectively. (C)
  as a function of
  . The red line shows the fit
  . (D)
. (D)  as a function of
  . The red line shows the fit
  . Error bars indicate the 95% confidence interval on the values of
  and
and  .
.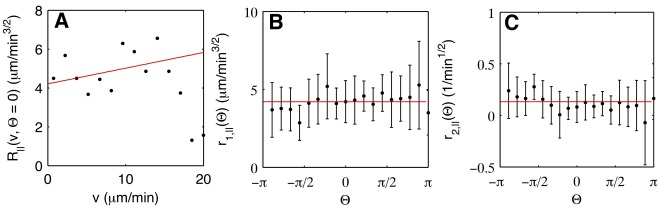
 . (B, C)
  and
and  are independent of
  . The red lines show constant fits.
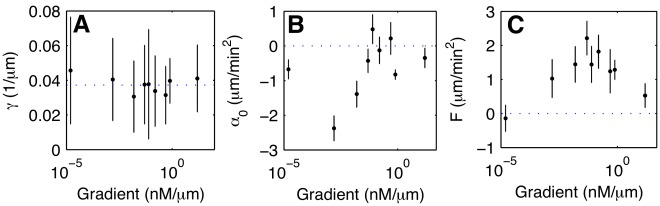
 , and effective force terms (B)
  , and (C)
  as a function of the gradient. The error bars indicate the standard deviation in (A) and the 95% confidence intervals in (B) and (C). As in Fig. 1D, the data point displayed at very low gradient values (
 nM/
nM/ m) corresponds to an experiment where no gradient of cAMP was applied.
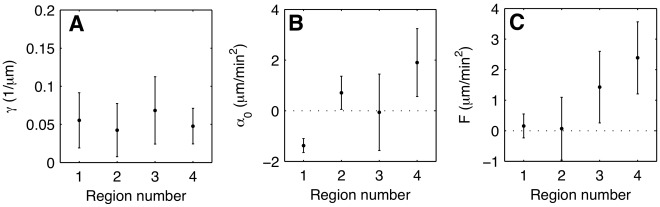
 , and effective force terms (B)
  , and (C)
  for each subpopulation. The error bars indicate the standard deviation in (A) and the 95% confidence intervals in (B) and (C).
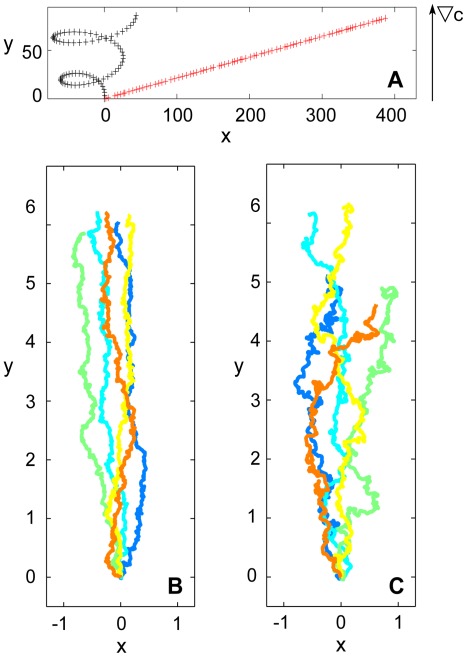
 ,
,  . (C) Trajectories of an Ornstein-Uhlenbeck process with drift,
  ,
,  . Also the trajectories in (B) and (C) have the same chemotactic index and the same average speed. The numbers on the axes are arbitrary space units.
References
-
- Martin P, Parkhurst SM. Parallels between tissue repair and embryo morphogenesis. Development. 2004;131:3021–3034. - PubMed
-
- Condeelis J, Singer RH, Segall JE. The great escape: When cancer cells hijack the genes for chemotaxis and motility. Annual Review of Cell and Developmental Biology. 2005;21:695–718. - PubMed
-
- Kay RR, Langridge P, Traynor D, Hoeller O. Changing directions in the study of chemotaxis. Nat Rev Mol Cell Biol. 2008;9:455–463. - PubMed
Publication types
MeSH terms
Substances
LinkOut - more resources
Full Text Sources
