. 2012;7(5):e37315.
doi: 10.1371/journal.pone.0037315. Epub 2012 May 25.

Reduced cortisol and metabolic responses of thin ewes to an acute cold challenge in mid-pregnancy: implications for animal physiology and welfare

Affiliations

Reduced cortisol and metabolic responses of thin ewes to an acute cold challenge in mid-pregnancy: implications for animal physiology and welfare

Else Verbeek et al. PLoS One. 2012.

Abstract

Background: Low food availability leading to reductions in Body Condition Score (BCS; 0 indicates emaciation and 5 obesity) in sheep often coincides with low temperatures associated with the onset of winter in New Zealand. The ability to adapt to reductions in environmental temperature may be impaired in animals with low BCS, in particular during pregnancy when metabolic demand is higher. Here we assess whether BCS affects a pregnant animal's ability to cope with cold challenges.

Methods: Eighteen pregnant ewes with a BCS of 2.7±0.1 were fed to attain low (LBC: BCS2.3±0.1), medium (MBC: BCS3.2±0.2) or high BCS (HBC: BCS3.6±0.2). Shorn ewes were exposed to a 6-h acute cold challenge in a climate-controlled room (wet and windy conditions, 4.4±0.1°C) in mid-pregnancy. Blood samples were collected during the BCS change phase, acute cold challenge and recovery phase.

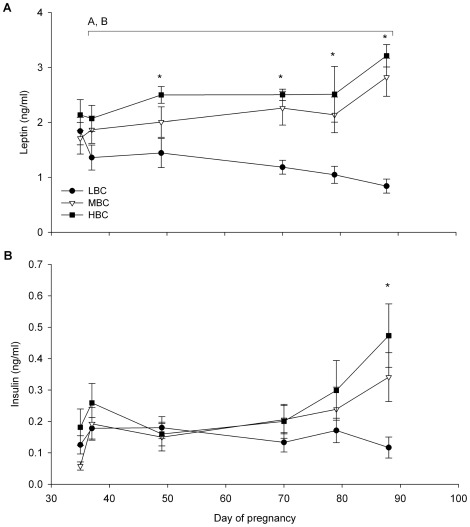
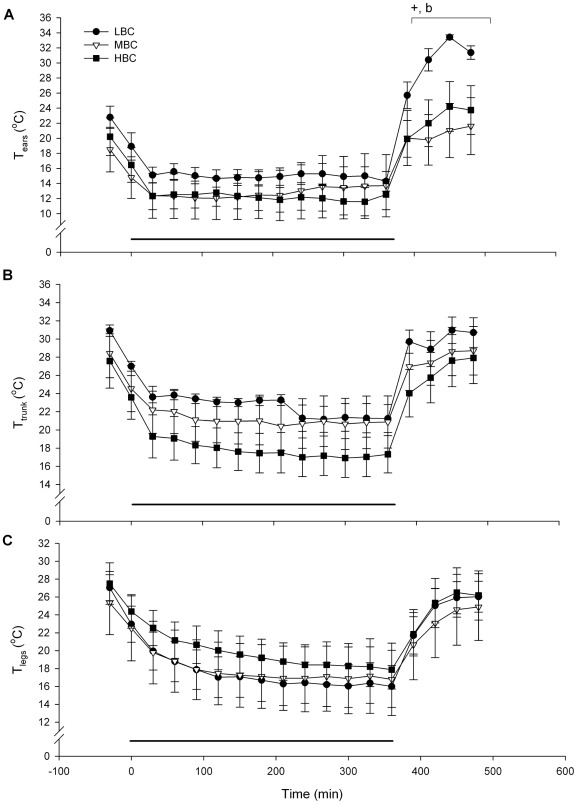
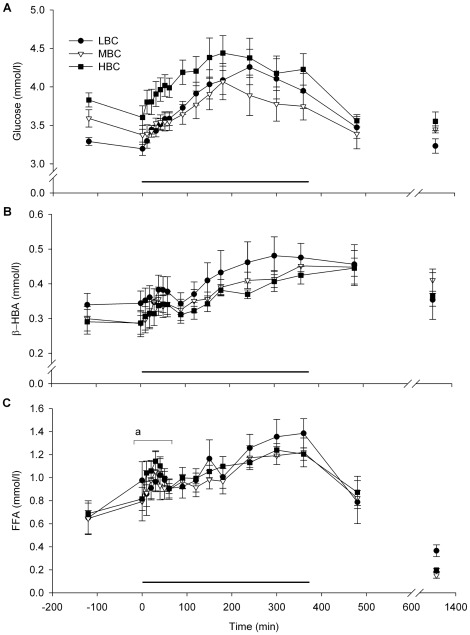
Results: During the BCS change phase, plasma glucose and leptin concentrations declined while free fatty acids (FFA) increased in LBC compared to MBC (P<0.01, P<0.01 and P<0.05, respectively) and HBC ewes (P<0.05, P<0.01 and P<0.01, respectively). During the cold challenge, plasma cortisol concentrations were lower in LBC than MBC (P<0.05) and HBC ewes (P<0.05), and FFA and insulin concentrations were lower in LBC than HBC ewes (P<0.05 and P<0.001, respectively). Leptin concentrations declined in MBC and HBC ewes while remaining unchanged in LBC ewes (P<0.01). Glucose concentrations and internal body temperature (T(core)) increased in all treatments, although peak T(core) tended to be higher in HBC ewes (P<0.1). During the recovery phase, T4 concentrations were lower in LBC ewes (P<0.05).

Conclusion: Even though all ewes were able to increase T(core) and mobilize glucose, low BCS animals had considerably reduced cortisol and metabolic responses to a cold challenge in mid-pregnancy, suggesting that their ability to adapt to cold challenges through some of the expected pathways was reduced.


Conflict of interest statement

Competing Interests: The study received combined funding from Beef+Lamb NZ and Meat and Livestock Australia, as well as additional funding from the Foundation for Research, Science and Technology. Furthermore, two authors were employed by AgResearch, a New Zealand crown research institute. The funding sources and author employment by AgResearch do not alter the authors' adherence to all the PLoS ONE policies on sharing data and materials.

Figures

Figure 1
Figure 1. Experimental timeline (D = day of gestation, BS = blood sample).
Figure 2
Figure 2. Mean (sem) live weight and BCS for LBC, MBC and HBC ewes between day 37 and 87 of pregnancy: (A) liveweight and (B) BCS.
AEffect of BCS treatment (P<0.01). BTime×treatment interaction (P<0.01), bTime×treatment interaction (P<0.05).
Figure 3
Figure 3. Mean (sem) metabolic responses for LBC, MBC and HBC ewes between day 37 and 87 of pregnancy: (A) glucose and (B) FFA plasma concentrations.
Aeffect of BCS treatment (P<0.01), bTime×BCS treatment interaction (P<0.05). *Indicates a significant BCS treatment difference at individual time points (ANOVA).
Figure 4
Figure 4. Mean (sem) endocrine responses for LBC, MBC and HBC ewes between day 37 and 87 of pregnancy: (A) leptin and (B) insulin plasma concentrations.
Aeffect of BCS treatment (P<0.01), BTime×BCS treatment interaction (P<0.01). *Indicates a significant BCS treatment difference at individual time points (ANOVA).
Figure 5
Figure 5. Mean (sem) internal body temperatures (°C) for LBC, MBC and HBC ewes during the acute cold challenge at day 85–87 of pregnancy.
The horizontal line indicates the period of the cold challenge (0–360 min). +Tendency for an effect of BCS treatment on peak Tcore (P<0.1).
Figure 6
Figure 6. Mean (sem) skin temperatures (°C) during the acute cold challenge for LBC, MBC and HBC ewes at day 85–87 of pregnancy: (A) ear skin temperature, (B) trunk skin temperature and (C) leg skin temperature.
The horizontal line indicates the period of the cold challenge (0–360 min). +Tendency for a BCS treatment effect (P<0.1), bTime×BCS treatment interaction (P<0.05).
Figure 7
Figure 7. Mean (sem) endocrine responses during the acute cold challenge for LBC, MBC and HBC ewes at day 85–87 of pregnancy: (A) plasma cortisol and (B) insulin responses to the acute cold challenge.
The horizontal line indicates the period of the cold challenge (0–360 min). aEffect of BCS treatment on peak plasma cortisol concentrations during the cold stress challenge (P<0.05, see also Table 2), Aeffect of BCS treatment during the cold stress challenge (P<0.01), BTime×BCS treatment interaction during the cold stress challenge (P<0.01), cEffect of BCS treatment during the recovery phase (P<0.05, 480 and 1320 min).
Figure 8
Figure 8. Mean (sem) endocrine responses during the acute cold challenge for LBC, MBC and HBC ewes at day 85–87 of pregnancy: (A) plasma leptin and (B) T4 responses to the acute cold challenge.
The horizontal line indicates the period of the cold challenge (0–360 min). aEffect of BCS treatment during the cold stress challenge, (P<0.05), BTime×BCS treatment interaction during the cold stress challenge (P<0.01), cEffect of BCS treatment during the recovery phase (P<0.05, 480 and 1320 min), CEffect of BCS treatment (P<0.01) during the recovery phase, DTime×BCS treatment interaction (P<0.01) during the recovery phase.
Figure 9
Figure 9. Mean (sem) metabolic responses to the acute cold challenge for LBC, MBC and HBC ewes at day 85–87 of pregnancy: (A) Glucose, (B) β-HBA, and (C) FFA plasma responses to the acute cold challenge.
The horizontal line indicates the period of the cold challenge (0–360 min). aEffect of BCS on AUC during the cold stress challenge (P<0.05). For more detailed statistics see Table 2.

References

    1. Kenyon PR, Morris ST, Revell DK, McCutcheon SN. Shearing during pregnancy - review of a policy to increase birthweight and survival of lambs in New Zealand pastoral farming systems. New Zeal Vet J. 2003;51:200–207. - PubMed
    1. Chrousos GP. Stress and disorders of the stress system. Nat Rev Endocrinol. 2009;5:374–381. - PubMed
    1. Sapolsky RM, Romero LM, Munck AU. How do glucocorticoids influence stress responses? integrating permissive, suppressive, stimulatory, and preparative actions. Endocr Rev. 2000;21:55–89. - PubMed
    1. Brunton PJ, Russell JA, Douglas AJ. Adaptive Responses of the Maternal Hypothalamic-Pituitary-Adrenal Axis during Pregnancy and Lactation. J Neuroendocinol. 2008;20:764–776. - PubMed
    1. Turner AI, Keating CL, Tilbrook AJ. Sex Differences and the Role of Sex Steroids in Sympatho-Adrenal Medullary System and Hypothalamo-Pituitary Adrenal Axis Responses to Stress. In: Kahn SM, editor. Sex steroids. Rijeka, Croatia: InTech; 2012. pp. 115–136.

Publication types