

Ensemble analysis of angiogenic growth in three-dimensional microfluidic cell cultures
- PMID: 22662145
- PMCID: PMC3360734
- DOI: 10.1371/journal.pone.0037333
Ensemble analysis of angiogenic growth in three-dimensional microfluidic cell cultures
Abstract
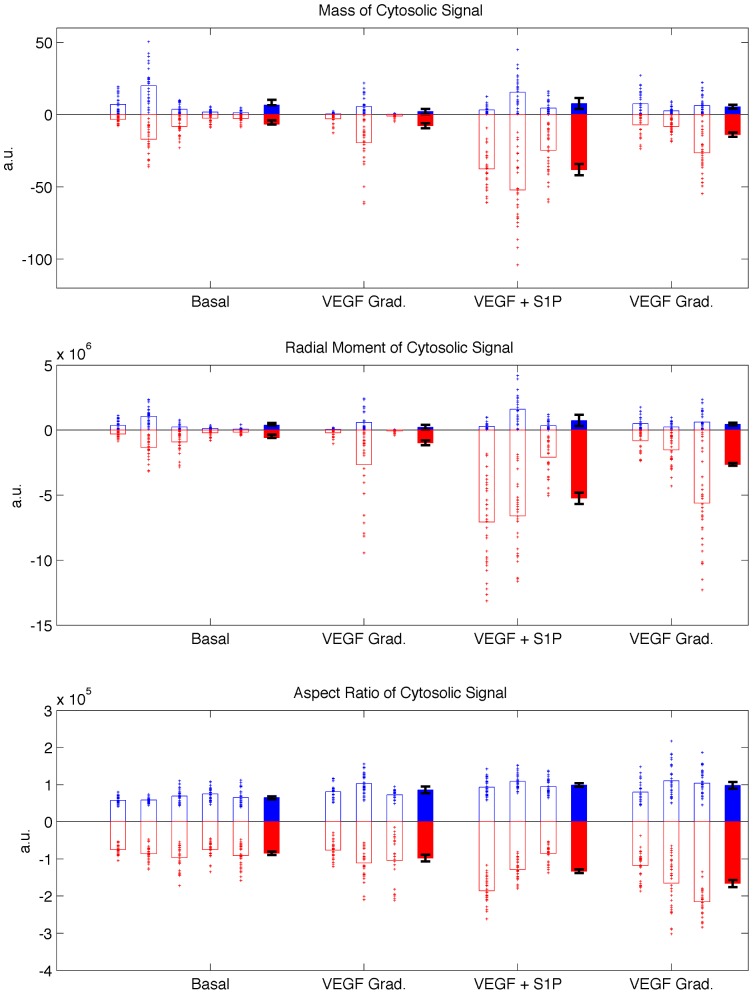
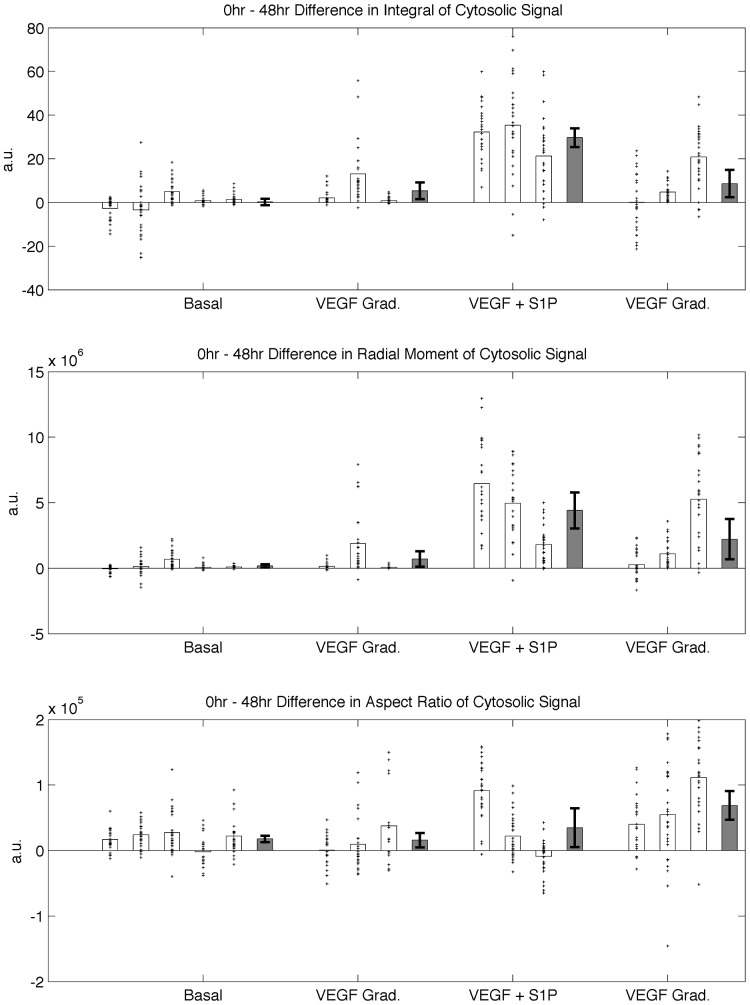
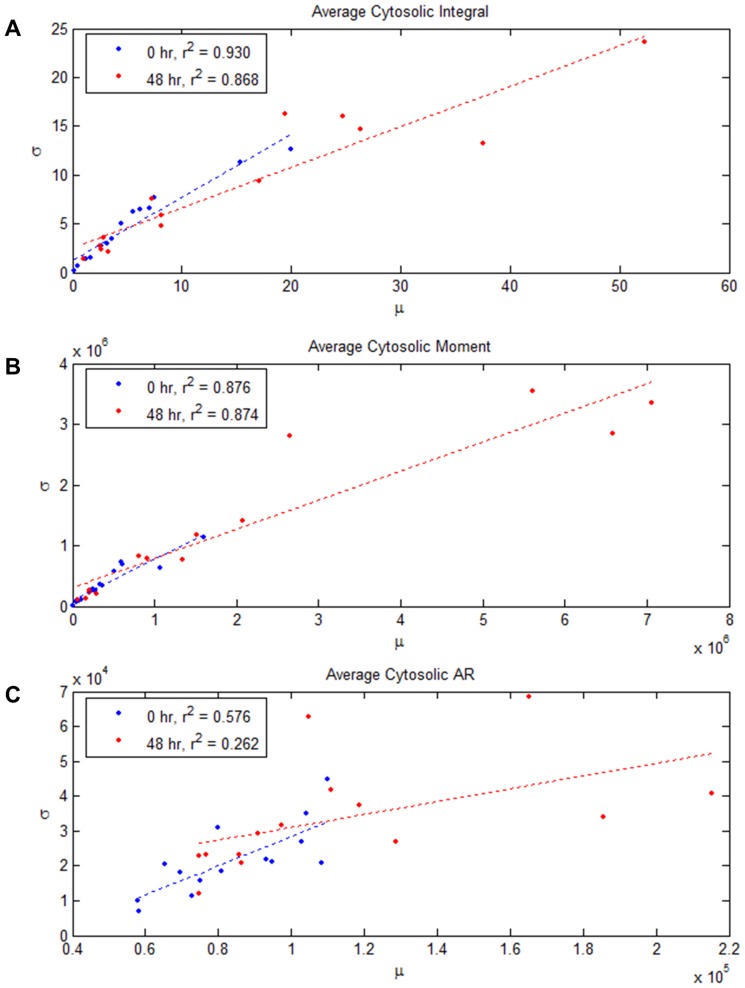
We demonstrate ensemble three-dimensional cell cultures and quantitative analysis of angiogenic growth from uniform endothelial monolayers. Our approach combines two key elements: a micro-fluidic assay that enables parallelized angiogenic growth instances subject to common extracellular conditions, and an automated image acquisition and processing scheme enabling high-throughput, unbiased quantification of angiogenic growth. Because of the increased throughput of the assay in comparison to existing three-dimensional morphogenic assays, statistical properties of angiogenic growth can be reliably estimated. We used the assay to evaluate the combined effects of vascular endothelial growth factor (VEGF) and the signaling lipid sphingoshine-1-phosphate (S1P). Our results show the importance of S1P in amplifying the angiogenic response in the presence of VEGF gradients. Furthermore, the application of S1P with VEGF gradients resulted in angiogenic sprouts with higher aspect ratio than S1P with background levels of VEGF, despite reduced total migratory activity. This implies a synergistic effect between the growth factors in promoting angiogenic activity. Finally, the variance in the computed angiogenic metrics (as measured by ensemble standard deviation) was found to increase linearly with the ensemble mean. This finding is consistent with stochastic agent-based mathematical models of angiogenesis that represent angiogenic growth as a series of independent stochastic cell-level decisions.
Conflict of interest statement
Figures
Similar articles
-
Perfused 3D angiogenic sprouting in a high-throughput in vitro platform.Angiogenesis. 2019 Feb;22(1):157-165. doi: 10.1007/s10456-018-9647-0. Epub 2018 Aug 31. Angiogenesis. 2019. PMID: 30171498 Free PMC article.
-
Induction of endothelial cell chemotaxis by sphingosine 1-phosphate and stabilization of endothelial monolayer barrier function by lysophosphatidic acid, potential mediators of hematopoietic angiogenesis.J Hematother Stem Cell Res. 1999 Dec;8(6):627-34. doi: 10.1089/152581699319795. J Hematother Stem Cell Res. 1999. PMID: 10645770
-
Hypoxia augments outgrowth endothelial cell (OEC) sprouting and directed migration in response to sphingosine-1-phosphate (S1P).PLoS One. 2015 Apr 15;10(4):e0123437. doi: 10.1371/journal.pone.0123437. eCollection 2015. PLoS One. 2015. PMID: 25875493 Free PMC article.
-
Quantitation of angiogenesis in vitro induced by VEGF-A and FGF-2 in two different human endothelial cultures - an all-in-one assay.Clin Hemorheol Microcirc. 2010;46(2-3):189-202. doi: 10.3233/CH-2010-1345. Clin Hemorheol Microcirc. 2010. PMID: 21135494
-
Differential effects of sphingosine 1-phosphate and lysophosphatidic acid on endothelial cells.Biochim Biophys Acta. 2002 May 23;1582(1-3):190-6. doi: 10.1016/s1388-1981(02)00155-5. Biochim Biophys Acta. 2002. PMID: 12069828 Review.
Cited by
-
Integration of neurogenesis and angiogenesis models for constructing a neurovascular tissue.Sci Rep. 2017 Dec 11;7(1):17349. doi: 10.1038/s41598-017-17411-0. Sci Rep. 2017. PMID: 29229920 Free PMC article.
-
Hydrocolloids of Egg White and Gelatin as a Platform for Hydrogel-Based Tissue Engineering.Gels. 2023 Jun 20;9(6):505. doi: 10.3390/gels9060505. Gels. 2023. PMID: 37367175 Free PMC article.
-
From individual to collective 3D cancer dissemination: roles of collagen concentration and TGF-β.Sci Rep. 2018 Aug 24;8(1):12723. doi: 10.1038/s41598-018-30683-4. Sci Rep. 2018. PMID: 30143683 Free PMC article.
-
Generation of stable advective-diffusive chemokine gradients in a three-dimensional hydrogel.AIP Adv. 2022 Feb 16;12(2):5.0064947. doi: 10.1063/5.0064947. eCollection 2022 Feb 1. AIP Adv. 2022. PMID: 40741165 Free PMC article.
-
3D Printing-Enabled DNA Extraction for Long-Read Genomics.ACS Omega. 2020 Aug 12;5(33):20817-20824. doi: 10.1021/acsomega.0c01912. eCollection 2020 Aug 25. ACS Omega. 2020. PMID: 32875216 Free PMC article.
References
-
- Chung S, Sudo R, Mack PJ, Wan CR, Vickerman V, et al. Cell migration into scaffolds under co-culture conditions in a microfluidic platform. Lab Chip. 2009;9:269–275. - PubMed
-
- Shamloo A, Heilshorn SC. Matrix density mediates polarization and lumen formation of endothelial sprouts in VEGF gradients. Lab on a Chip. 2010;10:3061–3068. - PubMed
Publication types
MeSH terms
Substances
LinkOut - more resources
Full Text Sources
Other Literature Sources
