

Construction and validation of a systematic ethogram of Macaca fascicularis in a free enclosure
- PMID: 22662158
- PMCID: PMC3360774
- DOI: 10.1371/journal.pone.0037486
Construction and validation of a systematic ethogram of Macaca fascicularis in a free enclosure
Abstract
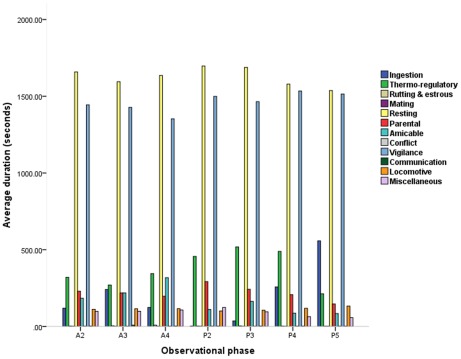
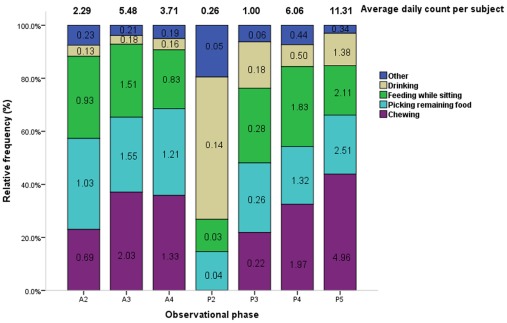
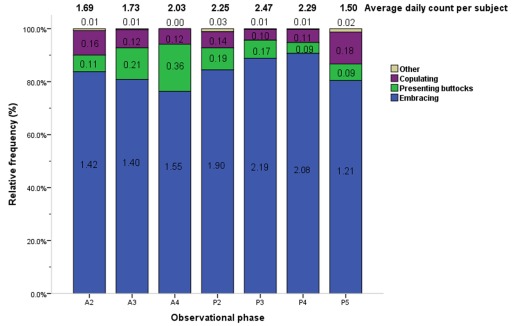
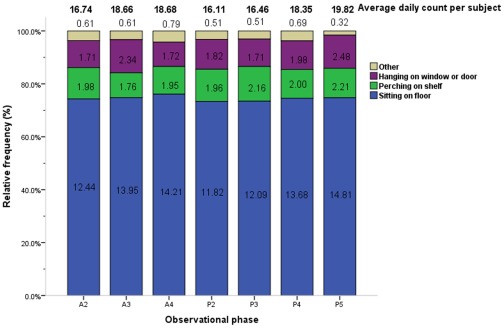
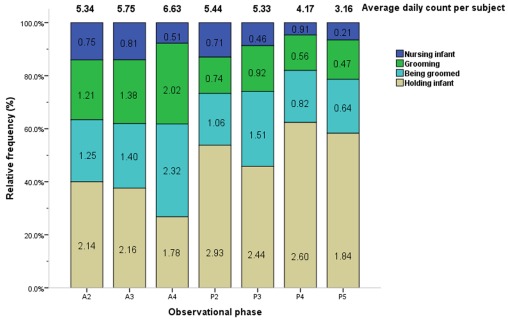
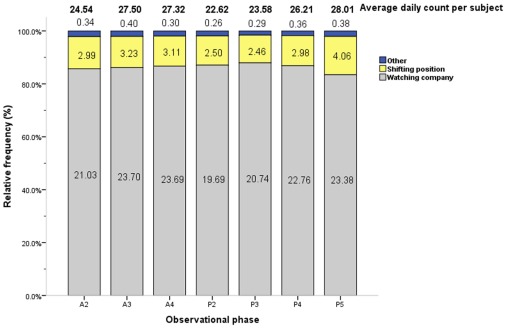
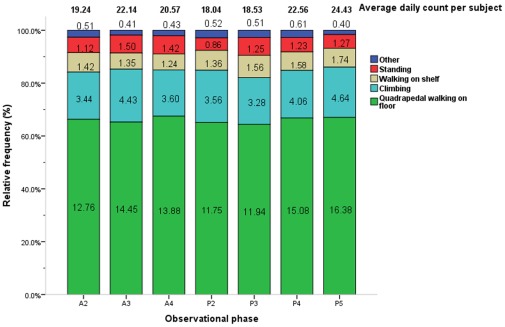
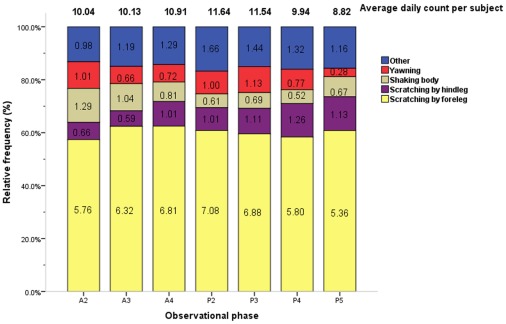
Behavioral studies in non-human primates have become ideal models for further investigations into advanced cognitive function in humans. To date, there is no systematic ethogram of the cynomolgus monkey (Macaca fascicularis) in a free enclosure. In a field observation of 6012 subjects, 107 distinct behaviors of M. fascicularis were preliminarily described. 83 of these behaviors were then independently validated through a randomized cohort and classified into 12 behavioral categories. 53 of these behaviors were then selected to accurately reflect the daily mundane activity of the species in a free enclosure. These findings systematically document the behavior of M. fascicularis in a free enclosure for use in further investigations.
Conflict of interest statement
Figures
Similar articles
-
Establishment of a standardized daily behavior collection and analysis system for brain disease models of rhesus and cynomolgus monkeys and its application in autism spectrum disorder.J Zhejiang Univ Sci B. 2024 Nov 15;25(11):972-995. doi: 10.1631/jzus.B2400294. J Zhejiang Univ Sci B. 2024. PMID: 39626880 Free PMC article.
-
The mutual influences between depressed Macaca fascicularis mothers and their infants.PLoS One. 2014 Mar 5;9(3):e89931. doi: 10.1371/journal.pone.0089931. eCollection 2014. PLoS One. 2014. PMID: 24599092 Free PMC article.
-
Differential behavior patterns in cynomolgus monkey Macaca fascicularis in home cage in response to human gaze.J Med Primatol. 2015 Feb;44(1):1-11. doi: 10.1111/jmp.12154. Epub 2014 Dec 2. J Med Primatol. 2015. PMID: 25440079
-
Role and ethics of cynomolgus monkey (Macaca fascicularis) blastoids in primate developmental biology research.J Med Primatol. 2024 Apr;53(2):e12693. doi: 10.1111/jmp.12693. J Med Primatol. 2024. PMID: 38374540 Review.
-
Genetic polymorphisms of drug-metabolizing cytochrome P450 enzymes in cynomolgus and rhesus monkeys and common marmosets in preclinical studies for humans.Biochem Pharmacol. 2018 Jul;153:184-195. doi: 10.1016/j.bcp.2017.12.015. Epub 2017 Dec 23. Biochem Pharmacol. 2018. PMID: 29277691 Review.
Cited by
-
Towards a comprehensive catalog of zebrafish behavior 1.0 and beyond.Zebrafish. 2013 Mar;10(1):70-86. doi: 10.1089/zeb.2012.0861. Zebrafish. 2013. PMID: 23590400 Free PMC article. Review.
-
TAK-653 Reverses Core Depressive Symptoms in Chronic Stress-Induced Monkey Model.Biomedicines. 2025 Jun 5;13(6):1389. doi: 10.3390/biomedicines13061389. Biomedicines. 2025. PMID: 40564108 Free PMC article.
-
Depressed female cynomolgus monkeys (Macaca fascicularis) display a higher second-to-fourth (2D:4D) digit ratio.Zool Res. 2019 May 18;40(3):219-225. doi: 10.24272/j.issn.2095-8137.2019.022. Epub 2019 Mar 28. Zool Res. 2019. PMID: 31011132 Free PMC article.
-
Biogeography of the large intestinal mucosal and luminal microbiome in cynomolgus macaques with depressive-like behavior.Mol Psychiatry. 2022 Feb;27(2):1059-1067. doi: 10.1038/s41380-021-01366-w. Epub 2021 Nov 1. Mol Psychiatry. 2022. PMID: 34719692 Free PMC article.
-
Pair housing of Macaques: A review of partner selection, introduction techniques, monitoring for compatibility, and methods for long-term maintenance of pairs.Am J Primatol. 2017 Jan;79(1):1-15. doi: 10.1002/ajp.22485. Epub 2015 Sep 30. Am J Primatol. 2017. PMID: 26422282 Free PMC article. Review.
References
-
- Cappenter S. Behavioral science claims the decade. Monitor on Psychology. 2000;31:22–24.
-
- Almond R, Kupfer DJ. Psychiatric inpatient research. Social system and planning issues. J Nerv Ment Dis. 1969;149:398–407. - PubMed
-
- Allen C, Bekoff M. Function natural design and animal behavior: philosophical and ethological considerations In: Thompson, N.S. (Ed),. Perspectives in Ethology. 1995;11:1–46.
-
- Beauchamp TL, Childress JF. Principles of Biomedical Ethics, 4th edn. Oxford Univ Press; 1994. pp. 12–45.
-
- Broom DM. Animal welfare: concepts and measurement. J Anim Sci. 1991;69:4167–4175. - PubMed
Publication types
MeSH terms
LinkOut - more resources
Full Text Sources
