. 2012 Jun;24 Suppl 1(s1):1-45.
doi: 10.3109/08958378.2012.691913. Epub 2012 Jun 4.

Health effects research and regulation of diesel exhaust: an historical overview focused on lung cancer risk

Affiliations
Free PMC article

Health effects research and regulation of diesel exhaust: an historical overview focused on lung cancer risk

Thomas W Hesterberg et al. Inhal Toxicol. 2012 Jun.
Free PMC article

Abstract

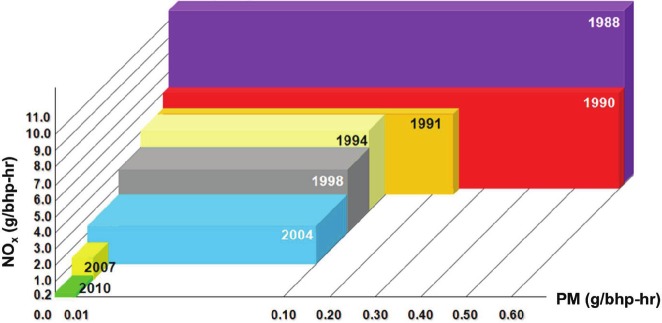
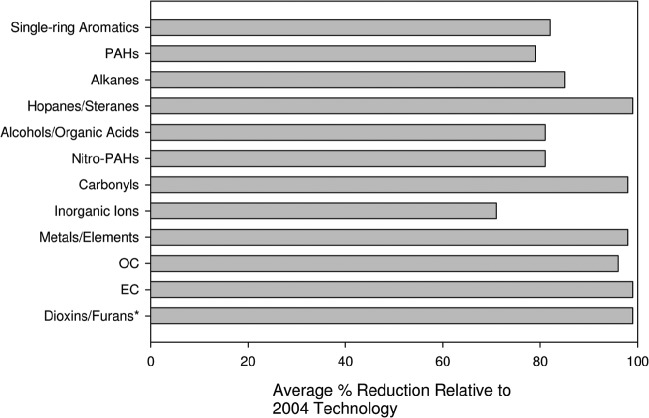
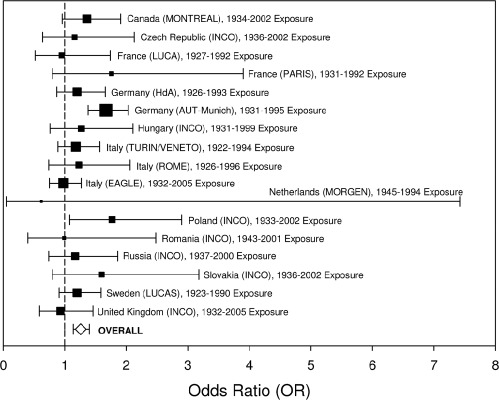
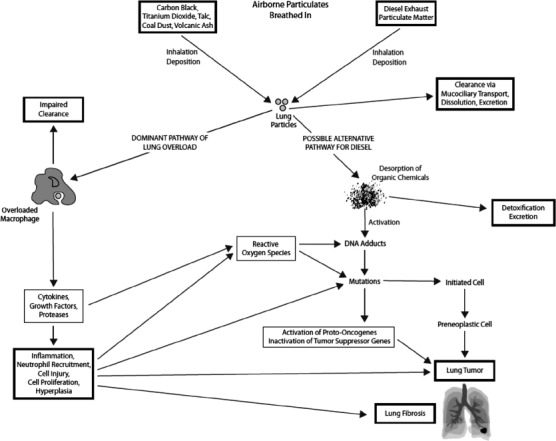
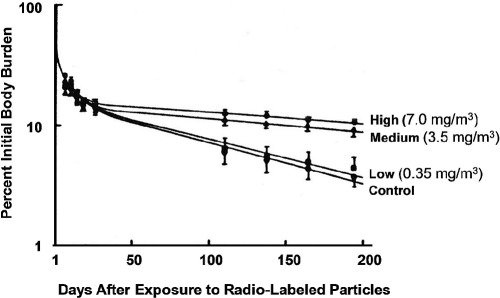
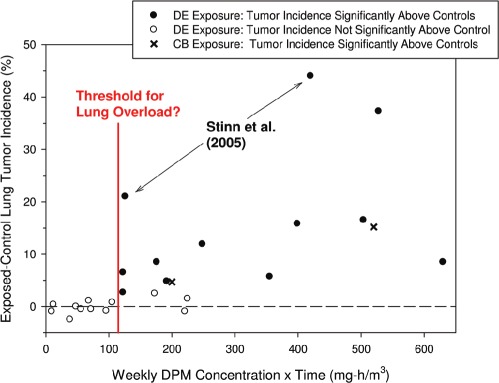
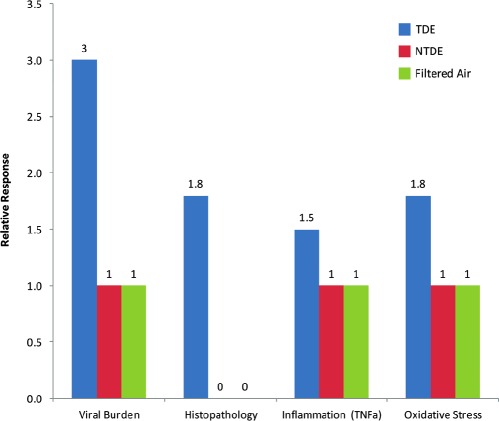
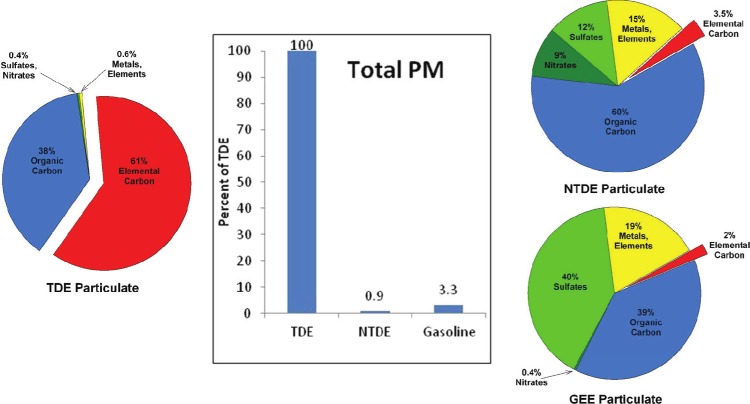
The mutagenicity of organic solvent extracts from diesel exhaust particulate (DEP), first noted more than 55 years ago, initiated an avalanche of diesel exhaust (DE) health effects research that now totals more than 6000 published studies. Despite an extensive body of results, scientific debate continues regarding the nature of the lung cancer risk posed by inhalation of occupational and environmental DE, with much of the debate focused on DEP. Decades of scientific scrutiny and increasingly stringent regulation have resulted in major advances in diesel engine technologies. The changed particulate matter (PM) emissions in "New Technology Diesel Exhaust (NTDE)" from today's modern low-emission, advanced-technology on-road heavy-duty diesel engines now resemble the PM emissions in contemporary gasoline engine exhaust (GEE) and compressed natural gas engine exhaust more than those in the "traditional diesel exhaust" (TDE) characteristic of older diesel engines. Even with the continued publication of epidemiologic analyses of TDE-exposed populations, this database remains characterized by findings of small increased lung cancer risks and inconsistent evidence of exposure-response trends, both within occupational cohorts and across occupational groups considered to have markedly different exposures (e.g. truckers versus railroad shopworkers versus underground miners). The recently published National Institute for Occupational Safety and Health (NIOSH)-National Cancer Institute (NCI) epidemiologic studies of miners provide some of the strongest findings to date regarding a DE-lung cancer association, but some inconsistent exposure-response findings and possible effects of bias and exposure misclassification raise questions regarding their interpretation. Laboratory animal studies are negative for lung tumors in all species, except for rats under lifetime TDE-exposure conditions with durations and concentrations that lead to "lung overload." The species specificity of the rat lung response to overload, and its occurrence with other particle types, is now well-understood. It is thus generally accepted that the rat bioassay for inhaled particles under conditions of lung overload is not predictive of human lung cancer hazard. Overall, despite an abundance of epidemiologic and experimental data, there remain questions as to whether TDE exposure causes increased lung cancers in humans. An abundance of emissions characterization data, as well as preliminary toxicological data, support NTDE as being toxicologically distinct from TDE. Currently, neither epidemiologic data nor animal bioassay data yet exist that directly bear on NTDE carcinogenic potential. A chronic bioassay of NTDE currently in progress will provide data on whether NTDE poses a carcinogenic hazard, but based on the significant reductions in PM mass emissions and the major changes in PM composition, it has been hypothesized that NTDE has a low carcinogenic potential. When the International Agency for Research on Cancer (IARC) reevaluates DE (along with GEE and nitroarenes) in June 2012, it will be the first authoritative body to assess DE carcinogenic health hazards since the emergence of NTDE and the accumulation of data differentiating NTDE from TDE.


Figures

Figure 1
Figure 1
Evolution of US heavy-duty diesel engine on-road emissions standards, expressed as grams PM or NOx emitted per brake-horsepower-hour (g/bhp-hr). Note that in 2004 two alternative standards were implemented: either a combined NOx+NMHC limit of 2.4 g/bhp-hr, or a NOx limit of 2.5 g/bhp-hr and a NMHC limit of 0.5 g/bhp-hr. See Table 1 for additional details and citations for the emissions standards. (See colour version of this figure online atwww.informahealthcare.com/iht)
Figure 2
Figure 2
Chemical compositions of PM in NTDE (data from Khalek et al., 2011; based on averaged data for four 2007-model-year heavy-duty diesel engines, including three equipped with a diesel oxidation catalyst (DOC) and a catalyzed diesel particulate filter (c-DPF), and engine equipped with an exhaust diesel fuel burner and c-DPF) versus TDE (data from US EPA, 2002; for 1990s-era diesel engine technology) from heavy-duty diesel engines. PM mass emissions bars for NTDE and TDE derived from data compiled in Hesterberg et al. (2008) for diesel school buses with and without catalyzed DPFs (used in conjunction with ULSD), respectively. Note that there can be variability in PM emissions for diesel engine technologies considered to emit NTDE and TDE, such that data from other studies may differ from those in the figure. In general, as illustrated in these comparisons, not only is less PM emitted in NTDE on a per mile basis, but the emitted PM differs in composition from the PM emitted in TDE. (See colour version of this figure online atwww.informahealthcare.com/iht)
Figure 3
Figure 3
Average % reductions for DEP chemical classes relative to 2004 diesel technology engines for ACES testing of four post-2006 technology diesel engines (data from Khalek et al., 2011). ACES testing for 12 repeats of 16-h transient cycle developed at West Virginia University that covers a complete engine operation with active regeneration events. *Reductions in dioxins/furans are for comparison with 1998 technology engines.
Figure 4
Figure 4
Average particle number emissions (note the logarithmic scale) for 2007 ACES engines (with and without c-DPF regeneration) versus a 2004 technology engine. As discussed in Khalek et al. (2011), data for the 2007 ACES engines were based on 12 repeats of the 20-min federal test procedure transient cycle (FTP) or 12 repeats of the 16-h cycle, each for all four ACES engines and for sampling from an unoccupied animal exposure chamber set up on a constant volume sampler (CVS). Data for the 2004 technology engine were based on six repeats of the FTP transient cycle from a full flow CVS. All data are reported on a brake-specific emissions basis, which is defined by Khalek et al. (2011) as the total emissions during a test interval over the work expressed in brake horsepower-hour.
Figure 5
Figure 5
Median predicted shift-level elemental carbon (EC) concentrations for trucking industry workers by decade (1971-1980,1981-1990,1991-2000), as reported in Davis et al. (2011). Job-specific concentrations are summarized, with multiple predictions for dockworkers corresponding to use of diesel-powered, propane-powered, and gasoline-powered forklifts and separate predictions for both mechanics and pickup & delivery drivers in warm versus cold climates. As discussed in Davis et al. (2011), their modeling analysis provides evidence of substantial reductions in truckers’ DE exposures over the last three decades. LH stands for long-haul, while P&D stands for pickup-and-delivery.
Figure 6
Figure 6
Histogram of predicted annual county-average ambient diesel particulate matter (DPM) concentrations for the US EPA National-Scale Air Toxics Assessment (NATA) modeling analyses of 1996 and 2005 year air pollutant emissions (data from US EPA, 2011). DPM emissions include both on-road and non-road emissions sources. County numbers (out of 3191 counties for the 1996 emission year modeling and 3221 counties for the 2005 emission year modeling; both including municipalities in Puerto Rico and counties in the US Virgin Islands) are provided above each bar. These data suggest a decline in ambient DE exposure levels between 1996 and 2005, although there have also been improvements in NATA methods (e.g. inventory improvements, modeling changes, background calculation revisions) over time that may affect the interpretation of any differences between the two NATA analyses.
Figure 7
Figure 7
Chart shows study-specific and overall pooled-study lung-cancer odds ratios (OR) and 95% confidence intervals (CIs) for the highest quartile of cumulative diesel exhaust exposure compared with never-exposed, adjusted for age, sex, cigarette pack-years, time-since-quitting smoking, and ever-employment in a “List A” job (from Olsson et al., 2011a). Studies are identified by locations, with study acronyms provided in parentheses. As summarized in our Table 4, Olsson et al. (2011a) pooled information from 11 European and Canadian case-control studies covering 13,304 cases, with exposures typically between the 1920s/1930s and the 1990s/2000s. As noted in Olsson et al. (2011a), the symbol size reflects weighting from the random effects analysis. For global testing of the heterogeneity between the study ORs, Olsson et al. (2011a) reported an overall /-squared (I2) of 13.8% (p = 0.292) and concluded that there was no significant heterogeneity.
Figure 8
Figure 8
Possible mechanistic pathways leading to lung tumors in rats exposed by inhalation to protracted, high concentrations of poorly-soluble particles (adapted from Hesterberg et al., 2005 and HEI, 1995).
Figure 9
Figure 9
Impaired lung clearance in rats of 134Cs-radiolabeled particles inhaled after the end of 24-months DE exposure (for high, medium, and low DE exposure concentrations of 7.0,3.5, and 0.35 \i%l m3, respectively) and for a control population (Omg/m3 DE exposure). Data points are means ± standard errors (SEs). From Wolff et al. (1987).
Figure 10
Figure 10
Relationship of normalized weekly exposure of rats to DEP versus rat lung tumor response (adapted from Mauderly and Garshick, 2009). Data from nine published studies with groups of 50 or more rats exposed >24 months to DE; data from the single chronic rat study published since the 1988 IARC DE review - Stinn et al. (2005) - are specifically labeled. Lung tumor increases are shown (exposed minus controls). Dashed line represents control incidence (no net increase). Open circles represent exposed groups with no statistically significant increase above the control incidence. Closed circles represent exposed groups with a statistically significant increase above individual control group lung tumor incidence. In addition to the DEP study data, we have also plotted data for carbon black (CB) from Nikula et al. (1995). Although Heinrich et al. (1995) also included a CB exposure group and observed a 27% excess in lung tumor incidence (exposed minus controls), we did not include this data point in the figure since the weekly exposure rate of 990 mg-h/m3 is well outside the range of DEP exposure rates and would have thus distorted the figure scale. (See colour version of this figure online atwww.informahealthcare. com/iht)
Figure 11
Figure 11
Summary of McDonald et al. (2004b) findings on the relative toxicity in mice of acute inhalation exposures (6h per day over 7 days) for a baseline uncontrolled, TDE emissions case (approximately 200 \ig/m3 DEP) versus an emissions reduction case (low-sulfur fuel, catalyzed ceramic trap, 7 ng/m3). Expressed as relative responses to filtered air, findings are shown for four indicators of acute lung toxicity, namely respiratory syncytial virus (RSV) resistance, histopathology, lung inflammation (specifically, measurements of tumor necrosis factor-a (TNF-a)), and oxidative stress. (See colour version of this figure online at www. informahealthcare.com/iht)
Figure 12
Figure 12
Comparison of total PM emissions (on a mass per-distance-traveled basis) and PM composition for light-duty automobile engine exhausts representative of TDE, NTDE, and GEE. All data based on particle composition measurements from Cheung et al. (2009), who conducted emissions testing on a chassis dynamometer for light-duty vehicles operated using different aftertreatment configurations and a cold-start New European Driving Cycle (NEDC) and a series of Artemis cycles. Specific vehicle configurations include a Euro 4+ Honda Accord (2.2 L, i-CDTi) equipped with a ceramic-catalyzed diesel particulate filter (c-DPF), a closed-coupled oxidation catalyst (pre-cat), and exhaust gas recirculation (EGR), operated using low sulfur (< 10 ppm) diesel fuel and lube oil with a sulfur content of 8900 ppm wt (considered to be NTDE); a Euro 3 Toyota Corolla (1.8 L) equipped with a three-way catalytic converter and operated using unleaded gasoline with a research octane number (RON) of 95 and fully synthetic lube oil (considered to be GEE); and a Euro 1 compliant Volkswagen Golf (TDI, 1.9 L) operated using diesel fuel with a nominal sulfur content of 50 ppm (considered to be TDE). (See colour version of this figure online at www. informahealthcare.com/iht)

Similar articles

Cited by

References

    1. American Conference of Governmental Industrial Hygienists (ACGIH) 2003. 2003 TLVs and BEIs: Threshold limit values for chemical substances and physical agents and biological exposure indices.
    1. Attfield MD, Schleiff PL, Lubin JH, Blair A, Stewart PA, Vermeulen R, Coble JB, Silverman DT. The Diesel Exhaust in Miners Study: A Cohort Mortality Study With Emphasis on Lung Cancer. J Natl Cancer Inst. 2012 doi:10.1093/jnci/djs035. - PMC - PubMed
    1. Arey J, Zielinska B, Atkinson R, Winer AM. Formation of nitroarenes during ambient high-volume sampling. Environ Sci Technol. 1988;22:457–462.
    1. Ayala A, Herner JD. Warrendale, PA: SAE International; 2005. Transient ultrafine particle emission measurements with a new fast particle aerosol sizer for a trap equipped diesel truck. Presented at Powertrain & Fluid Systems Conference & Exhibition, San Antonio, TX, October 24-27. Paper 2005-01-3800. Available at: http://papers.sae.org/2005-01-3800/
    1. Bagley ST, Baumgard KJ, Gratz LD, Johnson JH, Leddy DG. Characterization of fuel and aftertreatment device effects on diesel emissions. Res Rep Health Eff Inst. 1996;76:1–75. - PubMed

Publication types

MeSH terms