

Microarray-based gene expression profiling reveals the mediators and pathways involved in the anti-arthritic activity of Celastrus-derived Celastrol
- PMID: 22664142
- PMCID: PMC3389174
- DOI: 10.1016/j.intimp.2012.05.015
Microarray-based gene expression profiling reveals the mediators and pathways involved in the anti-arthritic activity of Celastrus-derived Celastrol
Abstract
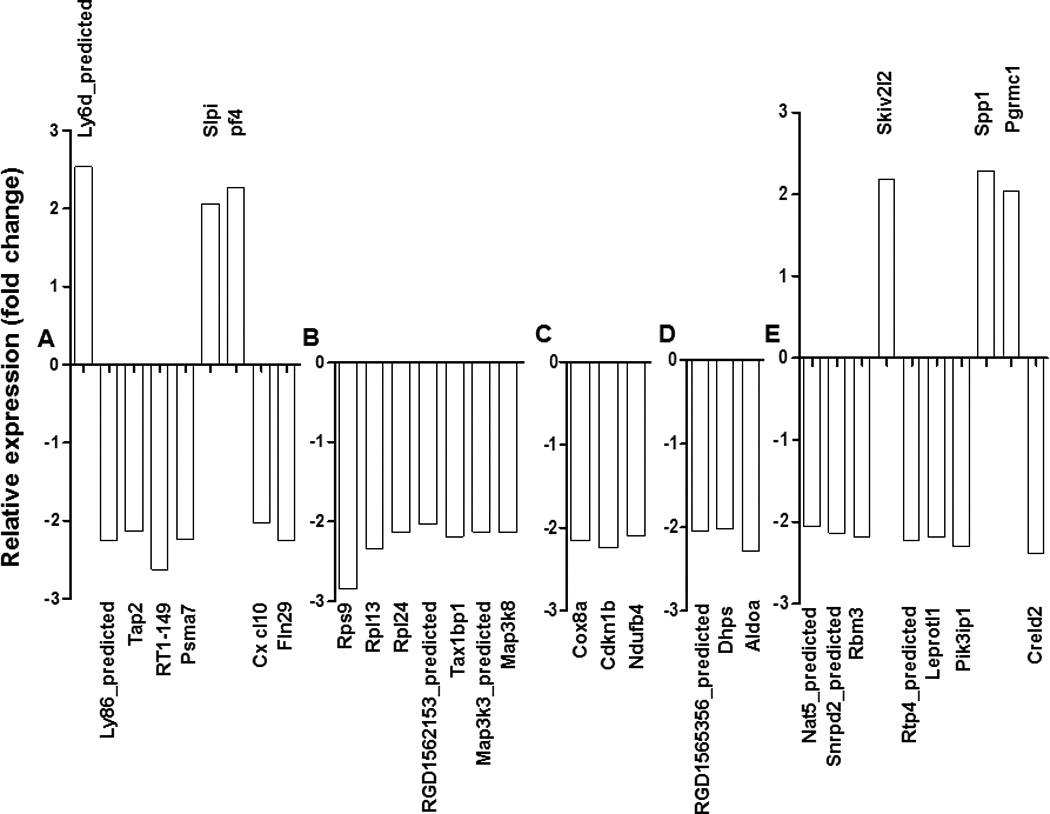
Rheumatoid arthritis (RA) is an autoimmune disease characterized by chronic inflammation of the joints. The prolonged use of non-steroidal anti-inflammatory drugs and other newer drugs is associated with severe adverse reactions. Therefore, there is a need for newer anti-arthritic agents. Celastrol, a bioactive component of the Chinese herb Celastrus, possesses anti-arthritic activity as tested in the adjuvant arthritis (AA) model of rheumatoid arthritis (RA). However, the mechanism of action of Celastrol has not been fully defined. We reasoned that microarray analysis of the lymphoid cells of Celastrol-treated arthritic animals might provide vital clues in this regard. We isolated total RNA of the draining lymph node cells (LNCs) of Celastrol-treated (Tc) and vehicle-treated (Tp) arthritic Lewis rats that were restimulated in vitro with the disease-related antigen, mycobacterial heat-shock protein 65 (Bhsp65), and tested it using microarray gene chips. Also tested was RNA from LNCs of control arthritic rats just before any treatment (T₀). Seventy six genes involved in various biological functions were differentially regulated by Bhsp65 in LNCs of Tp group, and 19 genes among them were shared by the Tc group. Furthermore, a group of 14 genes was unique to Tc. When Tc and Tp were compared, many of the Bhsp65-induced genes were related to the immune cells, cellular proliferation and inflammatory responses. Our results revealed 10 differentially expressed genes and 14 pathways that constituted the "Celastrol Signature". Our results would help identify novel targets for RA therapy.
Copyright © 2012 Elsevier B.V. All rights reserved.
Figures


References
-
- Feldmann M, Brennan FM, Maini RN. Rheumatoid arthritis. Cell. 1996 May 3;85(3):307–310. - PubMed
-
- Gorman CL, Cope AP. Immune-mediated pathways in chronic inflammatory arthritis. Best Pract Res Clin Rheumatol. 2008 Apr;22(2):221–238. - PubMed
-
- Lipsky PE. Rheumatoid arthritis. In: Fauci EB A, Kasper D, Hauser S, longo D, Jameson J, Loscalzo J, editors. Harrison's Principles of Intenrnal Medicine. 17 ed. New York: McGraw Hill New York, NY, USA; 2008. pp. 2083–2092.
Publication types
MeSH terms
Substances
Grants and funding
LinkOut - more resources
Full Text Sources
Medical
Research Materials
