. 2012 Oct;22(10):1940-52.
doi: 10.1101/gr.138248.112. Epub 2012 Jun 4.

Maintaining replication origins in the face of genomic change

Affiliations

Maintaining replication origins in the face of genomic change

Sara C Di Rienzi et al. Genome Res. 2012 Oct.

Abstract

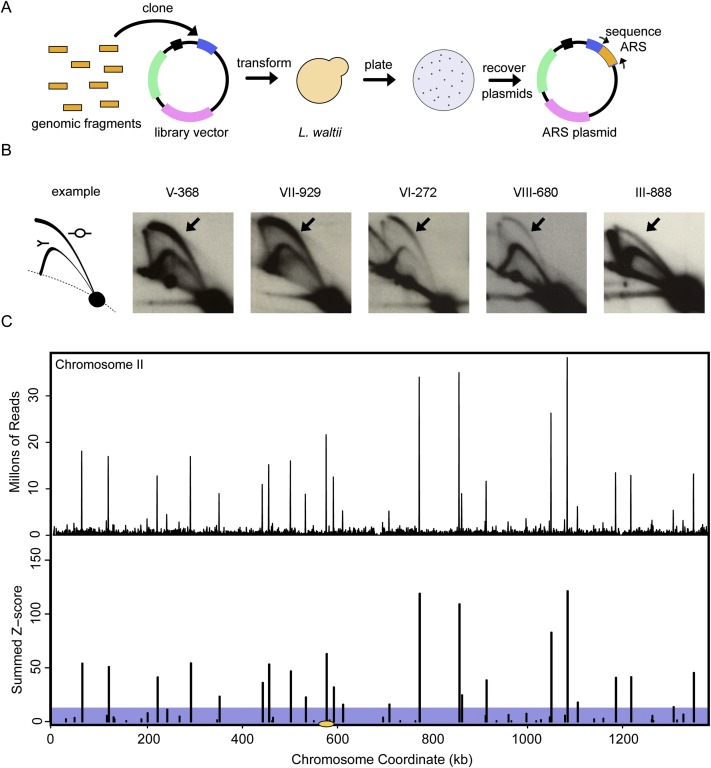
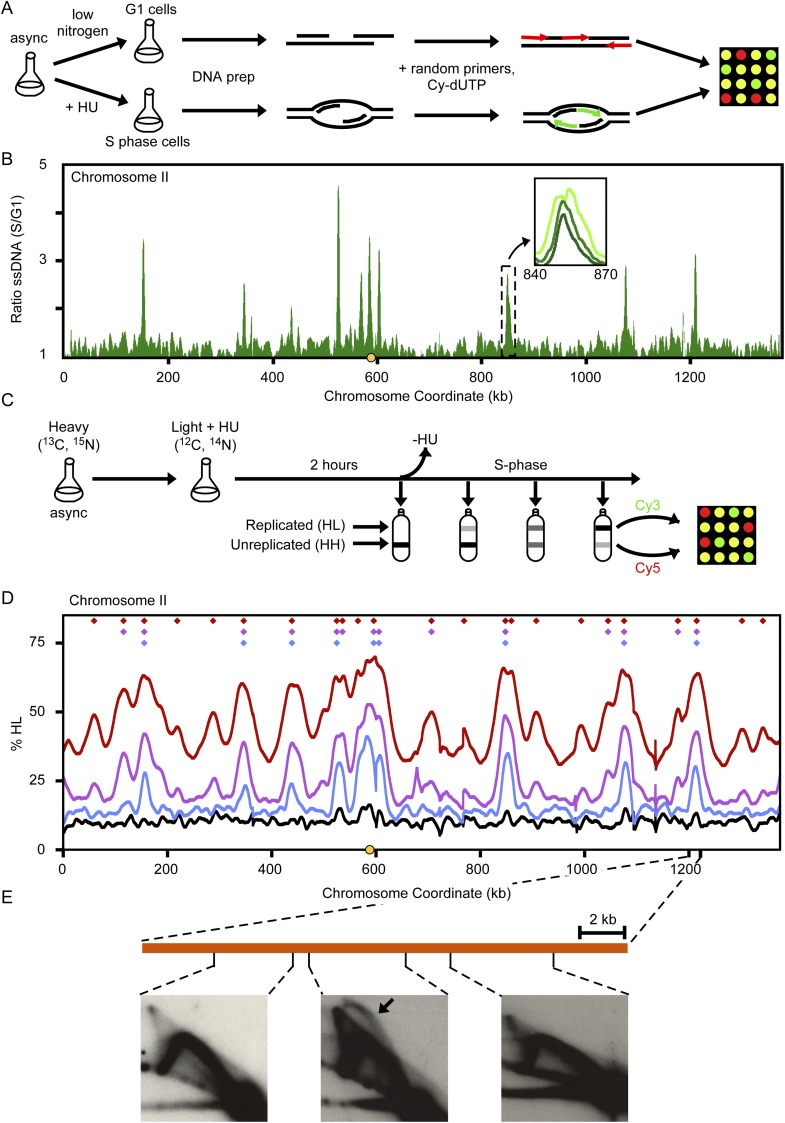
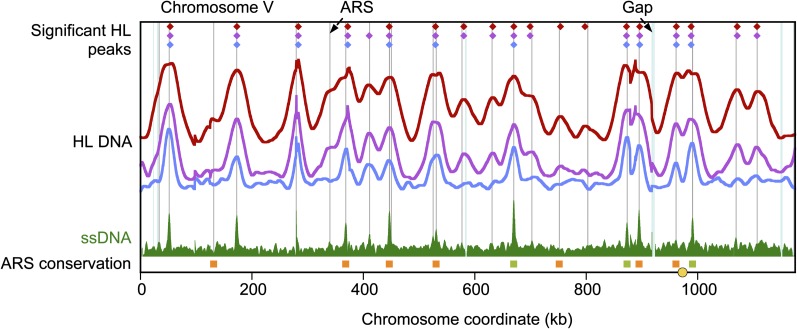
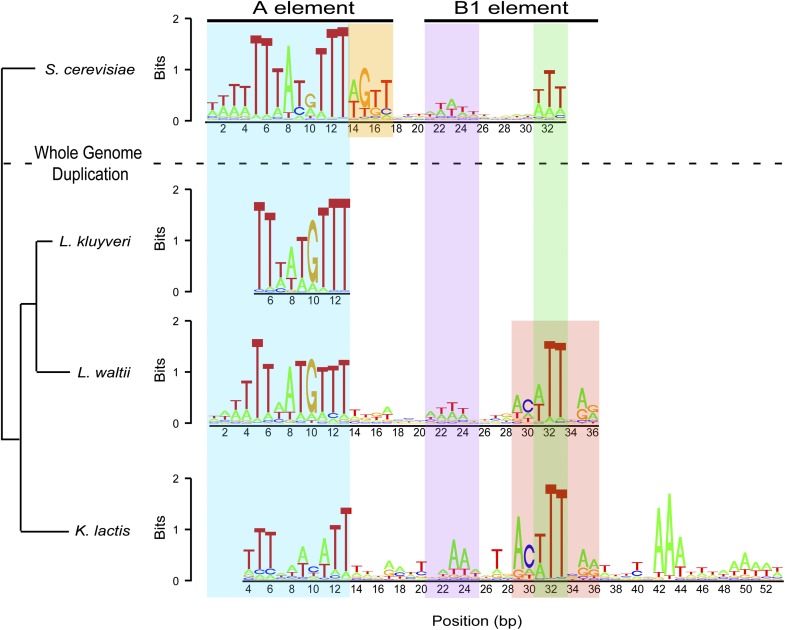
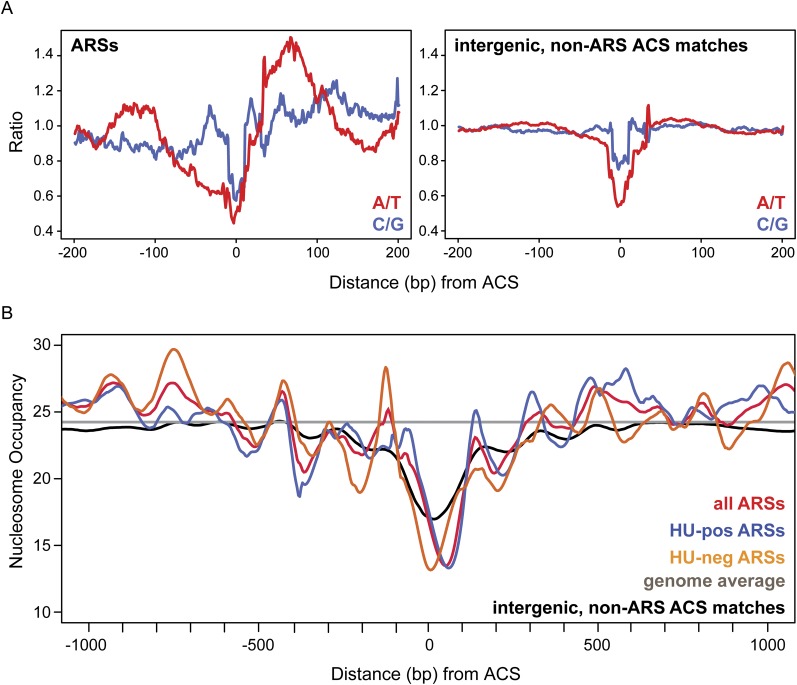
Origins of replication present a paradox to evolutionary biologists. As a collection, they are absolutely essential genomic features, but individually are highly redundant and nonessential. It is therefore difficult to predict to what extent and in what regard origins are conserved over evolutionary time. Here, through a comparative genomic analysis of replication origins and chromosomal replication patterns in the budding yeasts Saccharomyces cerevisiae and Lachancea waltii, we assess to what extent replication origins survived genomic change produced from 150 million years of evolution. We find that L. waltii origins exhibit a core consensus sequence and nucleosome occupancy pattern highly similar to those of S. cerevisiae origins. We further observe that the overall progression of chromosomal replication is similar between L. waltii and S. cerevisiae. Nevertheless, few origins show evidence of being conserved in location between the two species. Among the conserved origins are those surrounding centromeres and adjacent to histone genes, suggesting that proximity to an origin may be important for their regulation. We conclude that, over evolutionary time, origins maintain sequence, structure, and regulation, but are continually being created and destroyed, with the result that their locations are generally not conserved.


Figures

Figure 1.
Figure 1.
The ARS assay. (A) Sheared genomic DNA was cloned into a plasmid that contained a centromere but lacked a yeast origin of replication. The markers on the plasmid, indicated by boxes, in clockwise order and starting at the 1:00 position are LacZ (blue) multiple cloning site (contains SmaI, KpnI, and SacI sites), AmpR (pink), KanMXR (green), L. waltii CEN7 (black). Plasmids with genomic inserts were transformed into L. waltii and plated on G418. Colonies growing on G418 were presumed to have ARS elements in their inserts. These colonies were scraped and plasmids were extracted. Primers flanking the LacZ cloning site were used to identify the genomic insert (the ARS). (B) ARSs sequenced by Sanger sequencing were confirmed by genomic 2D gel analysis. The presence of a bubble arc (arrow) indicates that the sequence acts as a chromosomal origin. (C) All candidate ARSs were identified using Illumina sequencing. The top panel shows the raw sequencing data binned in 500-bp bins, shifting every 100 bp. The bottom panel shows the data after normalization against the genomic input library, removing all bins in the lower 97.5% of the data, summing adjacent remaining bins, and converting sequence read counts to Z-scores. Those remaining peaks with a summed Z-score of 12 or greater (above the shaded box) were scored as ARSs. The data for chromosome II are plotted with the centromere illustrated by a yellow ellipse. Plots for all chromosomes are shown in Supplemental Figure S1.
Figure 2.
Figure 2.
The ssDNA and density transfer assays. (A) Outline of ssDNA-based mapping of early-firing origins. L. waltii cells were treated with HU (200 mM) to enrich for ssDNA around origins of replication, or with low nitrogen medium to maintain cells in G1. ssDNA regions were labeled by random primed labeling without template denaturation and hybridized to a microarray. (B) The ratio of ssDNA in S/G1 is plotted for chromosome II. Early-firing origins are revealed as peaks in the plot. (Inset) Broadening in ssDNA peaks as S phase progresses. Plots for all chromosomes are shown in Supplemental Figure S2. (C) Outline of density transfer experiment to monitor replication dynamics. L. waltii cells were pregrown in a heavy isotope medium and then transferred to a light isotope medium containing HU (100 mM). After 2 h, HU was removed and cells were collected over the course of the S phase. DNA isolated from these samples were fragmented and subjected to ultracentrifugation to separate the heavy-heavy (HH), unreplicated DNA from the heavy-light (HL), replicated DNA. The HH and HL DNAs for each sample were labeled and competitively hybridized on a microarray. (D) Replication of chromosome II as revealed by the density transfer. The different colored lines correspond to samples taken at different times in the S phase: black (arrest), blue (15% HL), purple (25% HL), red (45% HL). The centromere is shown by a yellow circle on the x-axis. Color-coded diamonds above the plots indicate locations and samples in which origin activity (peaks of HL DNA) was detected. Plots for all chromosomes are shown in Supplemental Figure S3. (E) 2D gel analysis across a representative HL DNA peak confirms that the peak contains an origin.
Figure 3.
Figure 3.
All L. waltii replication data for chromosome V. Profiles of % HL and HL DNA peak locations (color-coded as in Fig. 2) are shown above the ssDNA profile. (Gray vertical lines) ARS locations. (Blue vertical lines) Sites that are redundant in the genome and cannot be mapped by Illumina sequencing data. (Filled squares) L. waltii ARSs that show syntenic conservation with ARSs in one or more other species (S. cerevisiae, L. kluyveri, and K. lactis). Orange, green, or brown squares indicate conservation with one, two, or all three of these species, respectively. (No instances of conservation with all three species were seen on this chromosome.) The yellow circle at the bottom represents the centromere. Plots for all chromosomes are shown in Supplemental Figure S4.
Figure 4.
Figure 4.
ACS alignment for S. cerevisiae, L. kluyveri, L. waltii, and K. lactis. The consensus sequence for L. waltii ARSs as compared with those in S. cerevisiae, L. kluyveri, and K. lactis are plotted showing the T-rich strand. (Blue box) 13-bp A element; (orange box) extended 17-bp A element. The purple, green, and red boxes show the B1 element. The S. cerevisiae ACS was taken from Eaton et al. (2010), the L. kluyveri ACS was taken from Liachko et al. (2011), and the K. lactis ACS was taken from Liachko et al. (2010). The tree phylogeny is based on Jeffroy et al. (2006).
Figure 5.
Figure 5.
A-T asymmetry and the nucleosome profile surrounding the L. waltii ACS. (A) The ratios of A/T and C/G bases around the L. waltii ACS are shown. All sequences were plotted such that the ACS begins at position 0 and are oriented such that the T-rich ACS strand is plotted. (Left plot) ACSs present in ARSs; (right plot) ACS matches found in intergenic, non-ARS locations. (B) The nucleosome profile surrounding the L. waltii ACS is shown. All nucleosome data are orientated as in A. The colored lines show the nucleosome profile: red, all ARSs; blue, HU-pos ARSs; orange, HU-neg ARSs; black, intergenic non-ARS ACS matches; gray, genome-wide average.

Similar articles

Cited by

References

    1. Alvino GM, Collingwood D, Murphy JM, Delrow J, Brewer BJ, Raghuraman MK 2007. Replication in hydroxyurea: It's a matter of time. Mol Cell Biol 27: 6396–6406 - PMC - PubMed
    1. Aparicio JG, Viggiani CJ, Gibson DG, Aparicio OM 2004. The Rpd3-Sin3 histone deacetylase regulates replication timing and enables intra-S origin control in Saccharomyces cerevisiae. Mol Cell Biol 24: 4769–4780 - PMC - PubMed
    1. Bailey TL, Elkan C 1994. Fitting a mixture model by expectation maximization to discover motifs in biopolymers. Proc Int Conf Intell Syst Mol Biol 2: 28–36 - PubMed
    1. Bailey TL, Gribskov M 1998. Combining evidence using p-values: Application to sequence homology searches. Bioinformatics 14: 48–54 - PubMed
    1. Bell SP 1995. Eukaryotic replicators and associated protein complexes. Curr Opin Genet Dev 5: 162–167 - PubMed

Publication types

Associated data